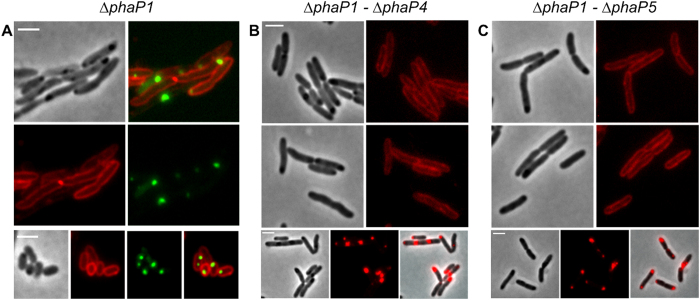
Figure 3. Expression of DsRed2EC-LactC2 in R. eutropha phasin mutants.
Co-expression of DsRed2EC-LactC2 and eYFP-PhaC in ∆phaP1 mutant (A). Expression of DsRed2EC-LactC2 in ∆phaP1-∆phaP4 mutant (B) and in ∆phaP1-∆phaP5 mutant (C). Phase contrast and fluorescent images are shown. In the bottom rows of (B,C) cells were additionally stained with Nile red to indicate the position of PHB granules more clearly than in phase contrast images (phase contrast, red channel, merge). Scale bars correspond to 2 μm.

