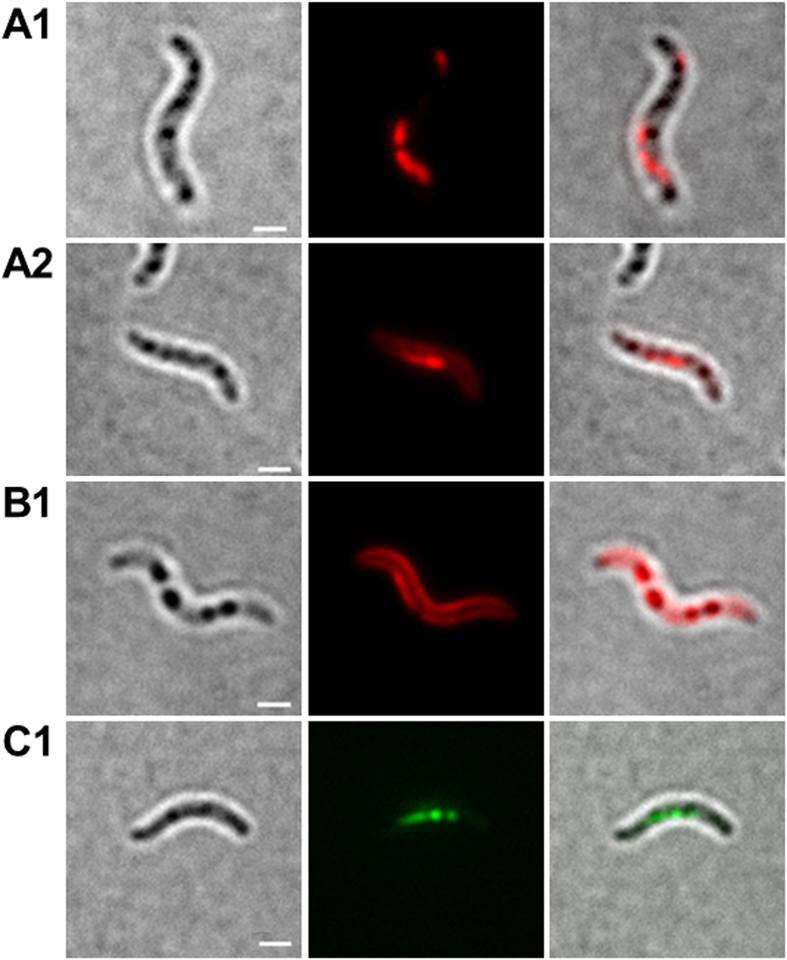
Figure 4. Expression fusion proteins in M. gryphiswaldense.
Cells expressing DsRed2EC-LactC2 focussed to filament-like fluorescence representing magnetosome-filaments (A1 and A2). Cell expressing DsRed2EC-LactC2 focussed to cell membrane fluorescence (B1). Cell expressing MamC-GFP (C1). Note, presence of several globular inclusions in all images (PHB granules) that do not co-localize with DsRed2EC-LactC2 or with MamC-eGFP. Individual magnetosomes are too small (≈35 nm) to be visible in bright field. From left to right: bright field, fluorescence channel, merge. Scale bars correspond to 2 μm.

