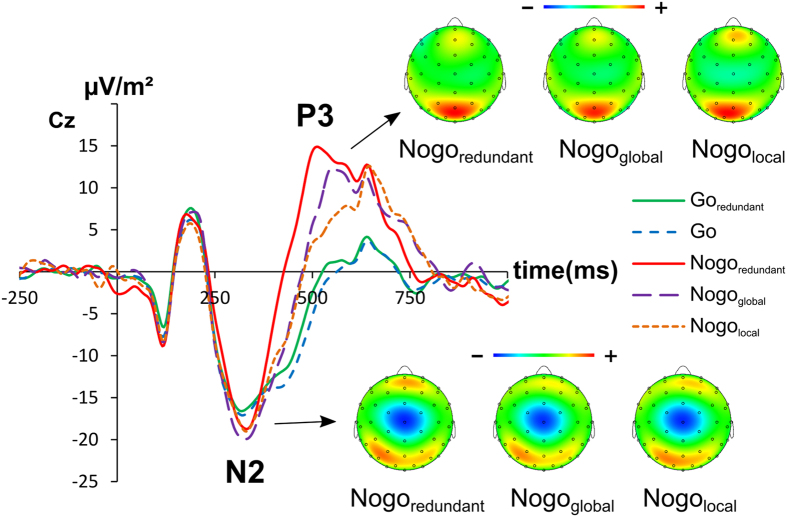
Figure 2. N2 amplitude at electrode Cz.
The y-axis denotes μV/m2 and the x-axis denotes the time in ms. Time point zero denotes the time point of stimulus presentation. The different lines show Goredundant (green), Go (blue), Nogoredundant (red), Nogoglobal (purple) and Nogolocal (orange). The topography plots show the distribution of the scalp electrical potential for the N2. Warm colors indicate positive and cold colors negative deflections. Additionally the topography plots for the P3 are displayed.

