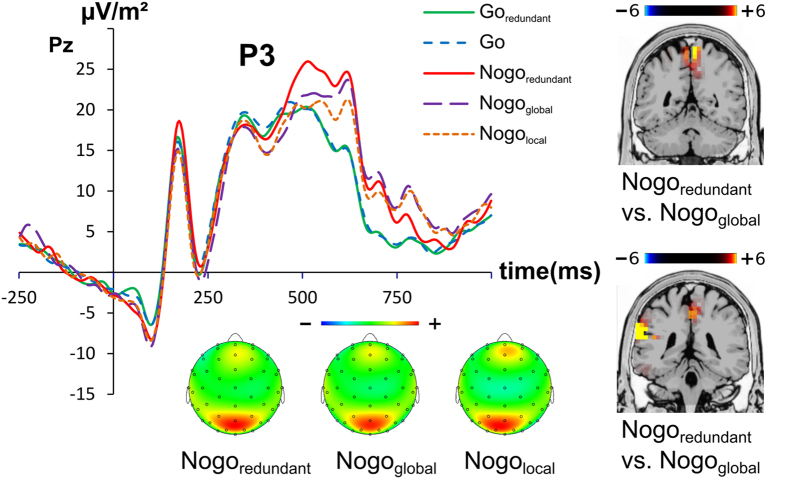
Figure 3. P3 amplitude at electrode Pz.
The y-axis denotes μV/m2 and the x-axis denotes the time in ms. Time point zero denotes the time point of stimulus presentation. The different lines show Goredundant (green), Go (blue), Nogoredundant (red), Nogoglobal (purple) and Nogolocal (orange). The topography plots show the distribution of the scalp electrical potential P3 (note that the scaling is slightly different between the conditions). Warm colors indicate positive and cold colors negative deflections. The P3 sLORETA plots are shown at the right side of the figure and denote the activation differences between the Nogoredundant vs. Nogoglobal (upper plot) and Nogoredundant vs. Nogolocal (lower plot) condition. The color scale denotes the critical t-values.

