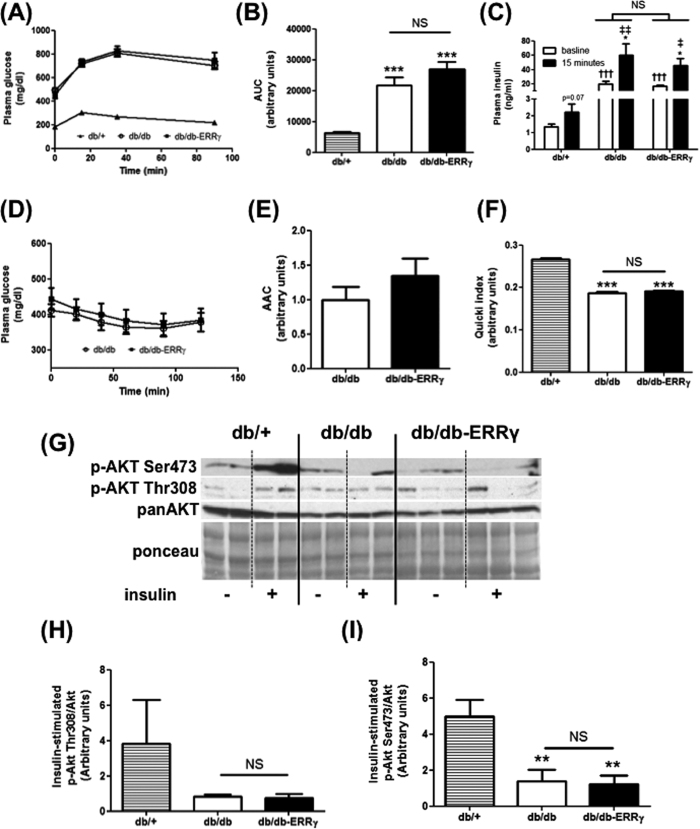
Figure 6. ERRγ does not mitigate insulin resistance in db/db mice.
Following parameters are measured in db/+ (▴ or hatched bar), db/db (○ or open bar) and db/db-ERRγ (▪ or black bar) mice. (A–C) Glucose tolerance test performed on 4 month-old male mice (N = 6–8). Plasma glucose (A), Area Under the Curve (AUC) (B), and plasma insulin before and 15 min after glucose injection (C) were measured. (D,E) Insulin tolerance test performed on 4 month-old male mice (N = 11–12). Plasma glucose (D) and Area Above the Curve (E) were measured. (F) Quicki index values (N = 6–8). (G–I) Insulin signaling measured on ex-vivo insulin stimulated quadriceps muscles of 6 month-old male mice (N = 4–5). (G) Representative images. (H) Akt thr-308 phosphorylation. (I) Akt ser-473 phosphorylation. *Indicates comparison to db/+ mice; †indicates db/db compared with db/db-ERRγ mice; ‡indicates baseline compared with t15 after glucose injection. (*p < 0.05, ****/††/‡‡p < 0.01, ***/†††p < 0.001, One-way ANOVA with Tukey’s post-test).

