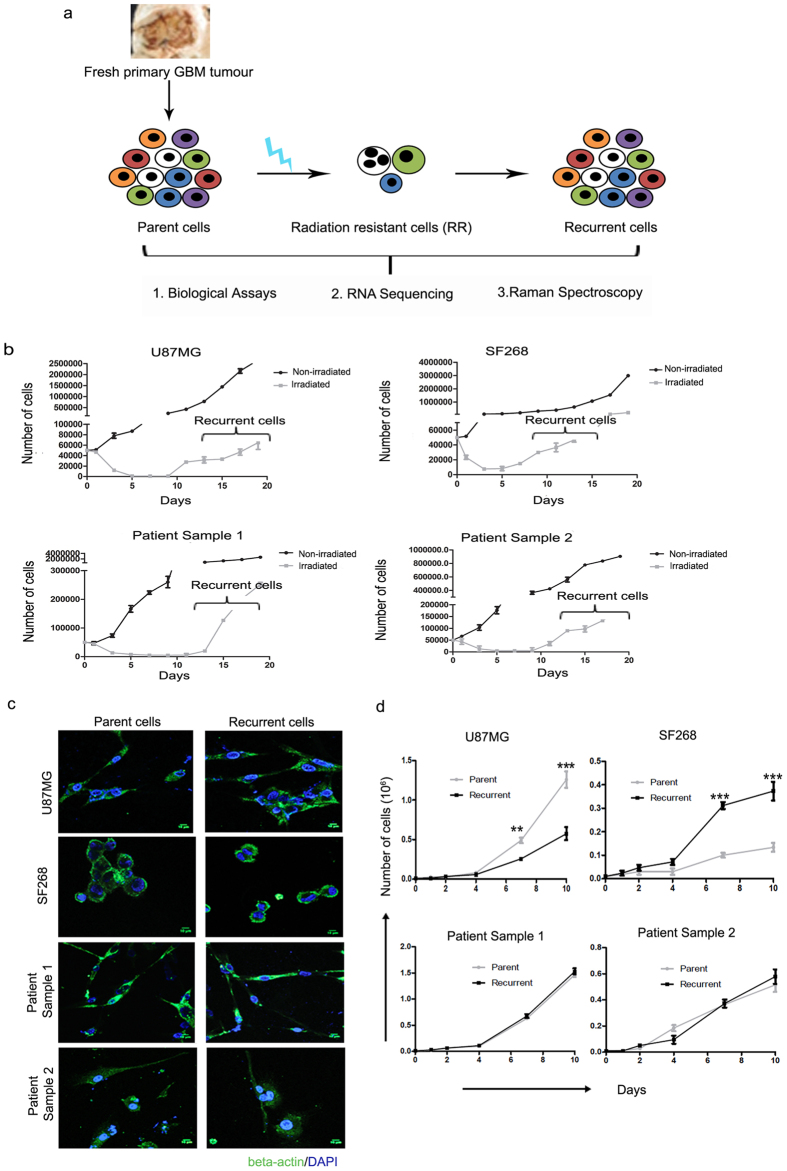
Figure 1. Recurrent cells generated from cellular model shows similar morphology and growth rate as that of parent cells.
(a) Shows schema of the study. (b) Graph shows the growth pattern of non-irradiated and irradiated parent cells from U87MG, SF268, patient sample 1 and patient sample 2. (c) Immunofluorescence images of the parent and the recurrent cells from the two cell lines and patient samples as indicated. Cells are stained for β-actin (green) and counterstained with DAPI (blue) to visualize the nucleus. (d) Line graphs show the growth curve for parent and recurrent cells. Cell growth was monitored by trypan blue assay. Results in each graph are the composite data from three independent experiments performed in triplicate (mean ± SEM); * denotes p ≤ 0.05, and ** denotes p ≤ 0.01. Scale bar for immunofluorescence images- 10 μm.

