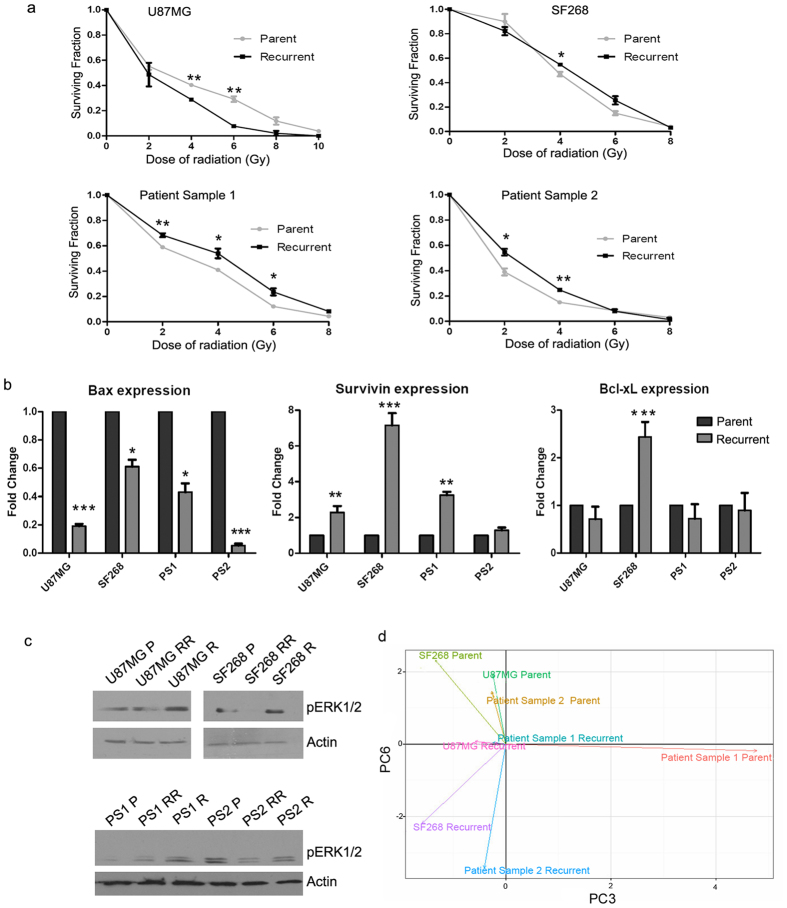
Figure 2. Recurrent cells reveal differences as compared to parent cells at the molecular level.
(a) Clonogenic survival assay curve showing the survival fraction at different doses of radiation for parent and recurrent cells of U87MG, SF268, patient samples 1 and patient sample 2. (b) Bar graph shows the transcript levels of pro-survival genes Survivin and Bcl-xL and pro-apoptotic gene Bax in parent and recurrent population as determined by qPCR. (c) Western blot analysis using anti-pERK1/2 and β-actin antibodies on parent cells (P), radiation resistant (RR) and recurrent (R) cells of the indicated samples. PS1 represents patient sample 1 and PS2 represents patient sample 2. (d) PCA plot of global transcripts between parent and recurrent cells. Results in each graph are the composite data from three independent experiments performed in triplicate (mean ± SEM); *** denotes p ≤ 0.001.

