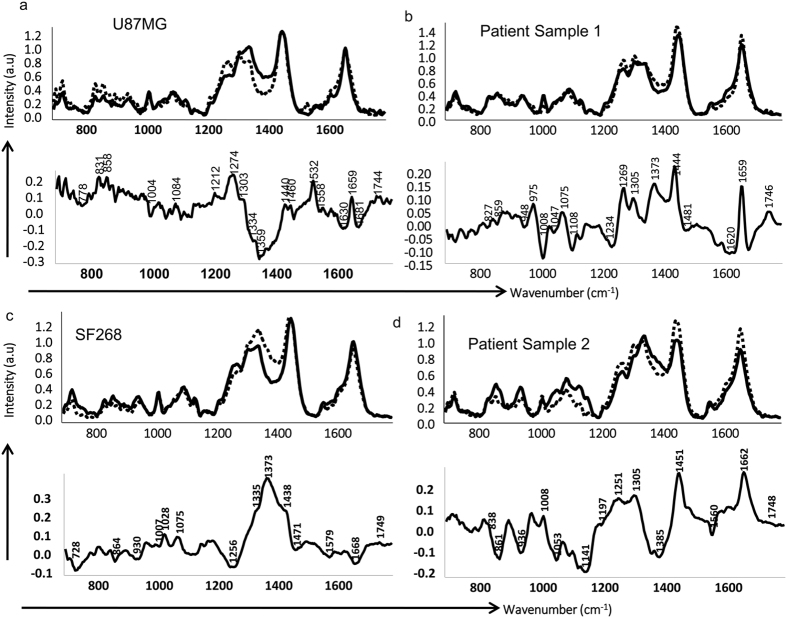
Figure 3. Mean and difference spectra from parent and recurrent population reveals spectral features unique to recurrent population.
(a–d) Shows the mean spectra and difference spectra of parent and recurrent population obtained for U87MG, SF268, patient samples 1 and patient sample 2, respectively. Dotted lines represent recurrent cells and solid lines represent parent cells.

