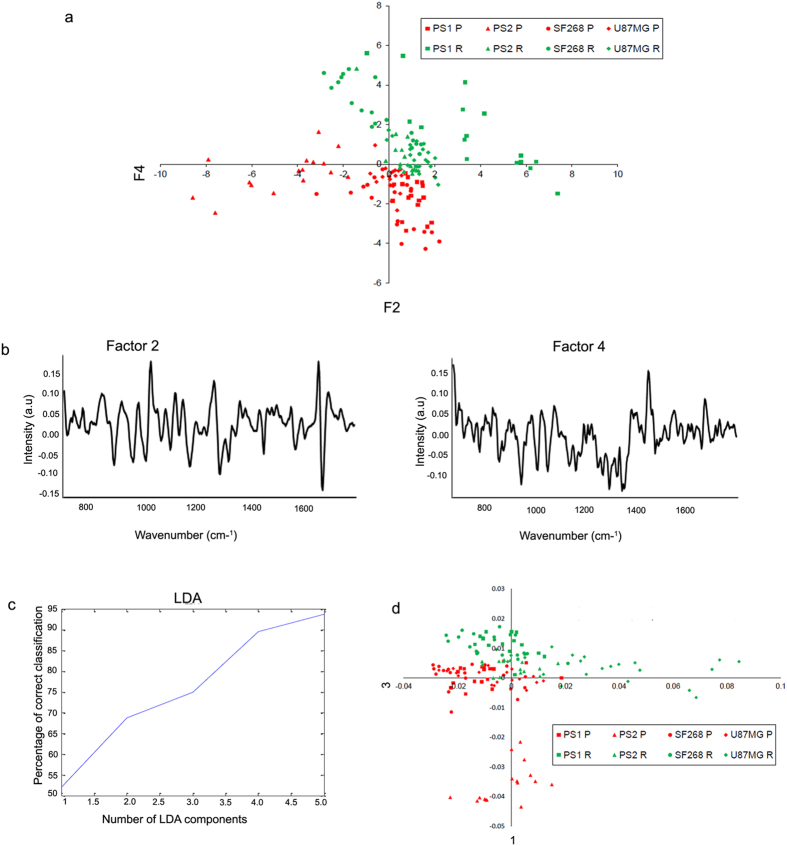
Figure 4. PCA and PCA-LDA analysis classifies the recurrent cells from parent cells.
(a) PCA scatter plot for parent and recurrent populations from the cell lines and two samples. (b) Spectra show the loadings of factor 2 and 4. (c) The PCA factors used for LDA are shown. (d) PCA-LDA scatter plot for parent and recurrent populations are shown.

