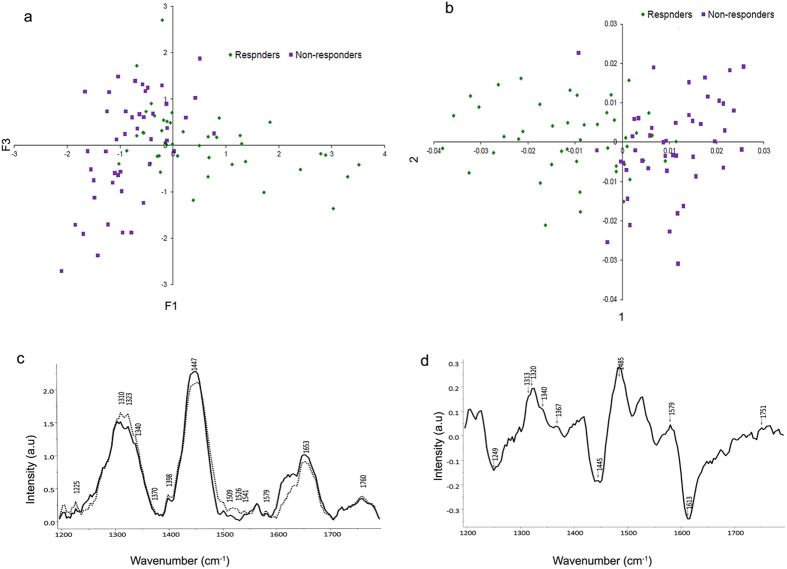
Figure 5. Raman spectroscopic analysis distinctly classifies the non-responders from responders group of patients.
(a) PCA scatter plot for non-responders and responders patient samples. (b) PCA-LDA scatter plot for non-responders and responders patient samples. (c) Mean spectra of the responding group from the non-responding group of samples. Dotted lines represent non-responding group while solid lines represent responding group of patients. (d) Difference spectra computed after subtracting spectra of responding group from the non-responding group of samples.

