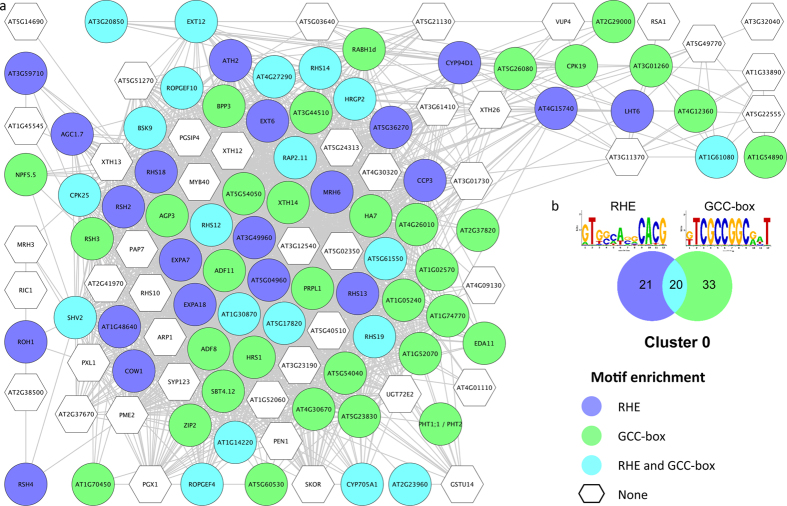
Figure 1. Cluster 0 of the co-expression network comprising genes that were differentially expressed in roots.
(a) Genes were clustered based on their co-expression relationships with a Pearson’s correlation coefficient of ≥0.90. The colour of the nodes indicates the presence of either the RHE, the GCC-box or both motifs as indicated in b. (b) Logo, colour code and number of genes that contain the motifs.

