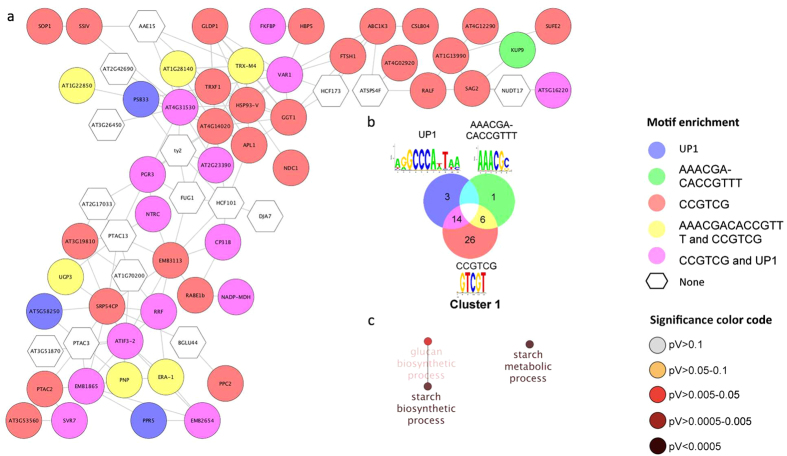
Figure 3. Cluster 1 of the co-expression network comprising genes that were differentially expressed in roots.
(a) Genes were clustered based on their co-expression relationships with a Pearson’s correlation coefficient of ≥0.90. The colour of the nodes indicates the presence of the various motifs indicated in b. (b) Logo, colour code and number of genes that contain the motifs. (c) Visualization the non-redundant biological gene ontology terms. The size of the nodes corresponds to the number of the genes associated to a term. The significance is represented by the colour of the nodes. Networks were constructed by ClueGo and displayed in ‘significance view’ by Cytoscape (http://apps.cytoscape.org/apps/cluego).

