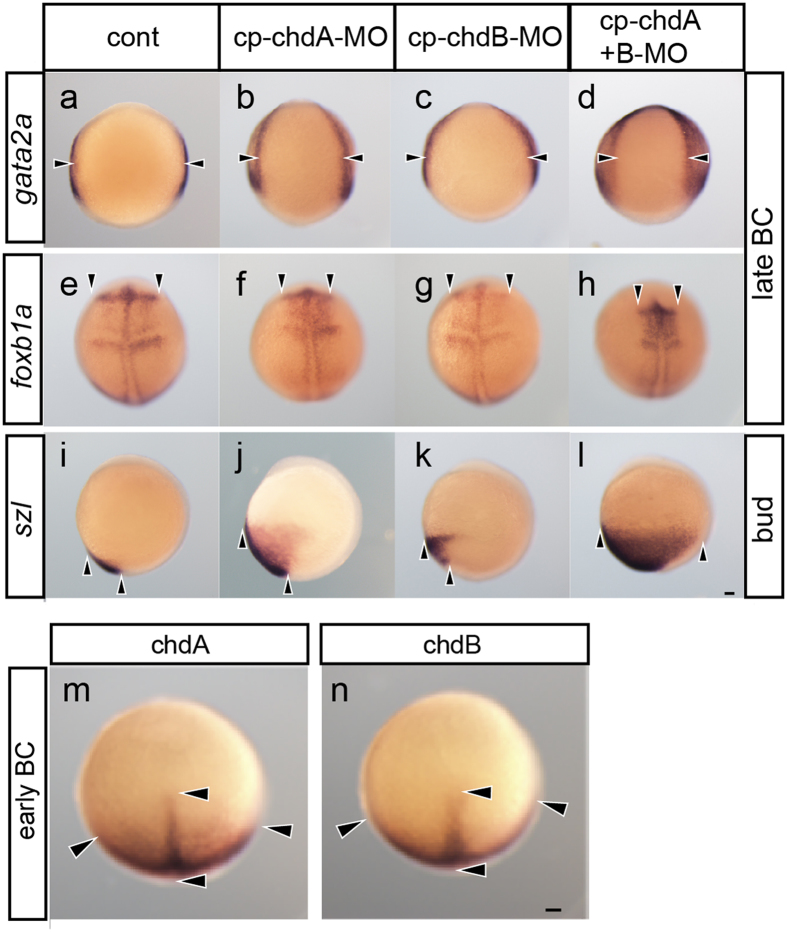
Figure 3. Comparison of gene expression patterns in chordin gene deficient common carp.
Expression patterns of gata2a (dorsal view; a–d), foxb1a (e–h; dorsal view), and szl (i–l; lateral view) genes in control (a,e,i), chdA- (b,f,j), chdB- (c,g,k), and chdA and -B double morphant embryos (d,h,l). (m,n) Expression patterns of chdA and -B genes in the animal pole view of common carp embryos at the early blastopore closure stage (black arrowheads indicate areas of gene expression). Panels (a–l,u,v) are shown at the same magnification. Black arrowheads indicate areas of gene expression. Scale bars = 0.1 mm.

