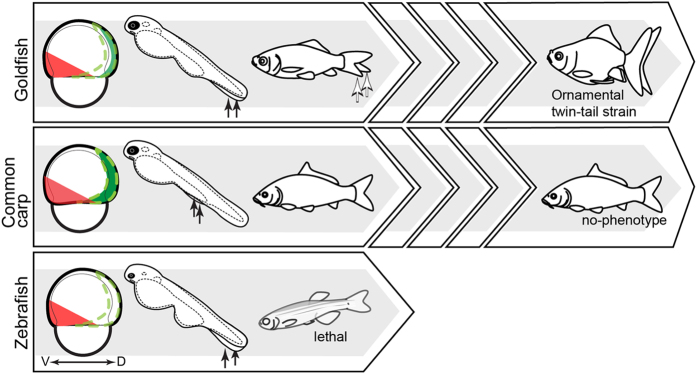
Figure 4. Schematic drawing of the hypothetical evolutionary consequences of chordin mutation.
The three large arrow-shaped boxes on the left represent a single generation of goldfish (top), common carp (middle), and zebrafish (bottom). Drawings of early-, late, and post-embryonic phenotypes are shown for each species. The narrow arrow-shaped boxes shown for goldfish and common carp represent multiple generations. Black and white arrows within the arrow-shaped boxes indicate bifurcated fin folds and bifurcated caudal fins, respectively. Expression patterns of ventral markers and chdB genes are represented by red and dark green areas, respectively. The boundaries of the original expression patterns of goldfish chdA and the zebrafish chordin gene are indicated by green dashed lines. V: ventral; D: dorsal.

