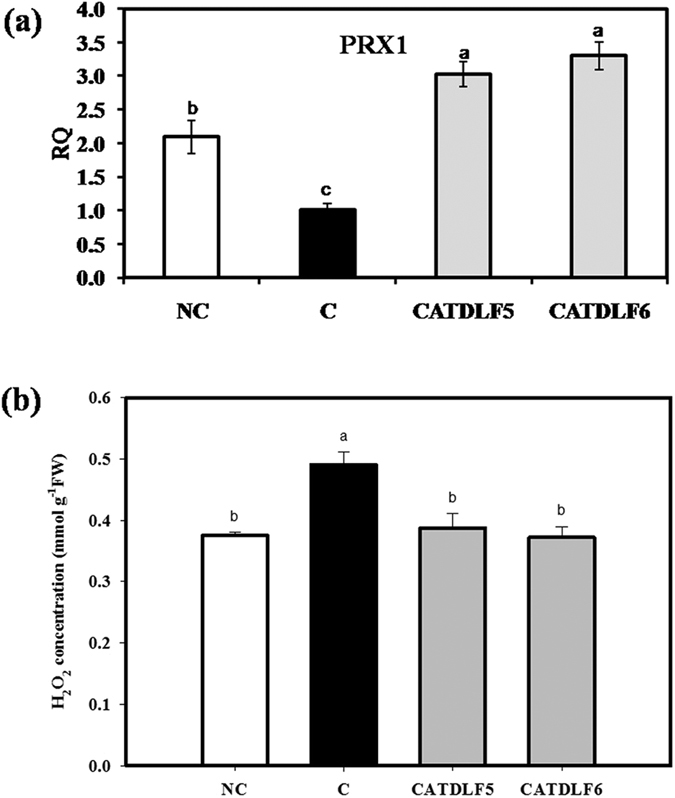
Figure 5. Effect of endophytes (CATDLF5 and CATDLF6) on PRX1 expression and hydrogen peroxide concentration.

(a) Transcript abundance of PRX1, (b) Hydrogen peroxide concentration in the plant leaf. NC- the natural control plants that originated from C. roseus seeds that were not treated with any bacteriocide and fungicide and contained all the naturally occurring endophytes present in the plants. C- the endophyte-free control plants that originated from C. roseus seeds treated with bactericides and fungicides and were thus devoid of any naturally occurring endophyte. In the qRT-PCR analysis, the endophyte-free control (C) was used as the calibrator and for normalization, C. roseus actin gene was used as the endogenous gene. In (a) Y-axis represents relative quantity (RQ). Data are means ± SD (n = 3 biological replicates). Values with different letters are significantly different (Duncan’s multiple range test *P < 0.05).
