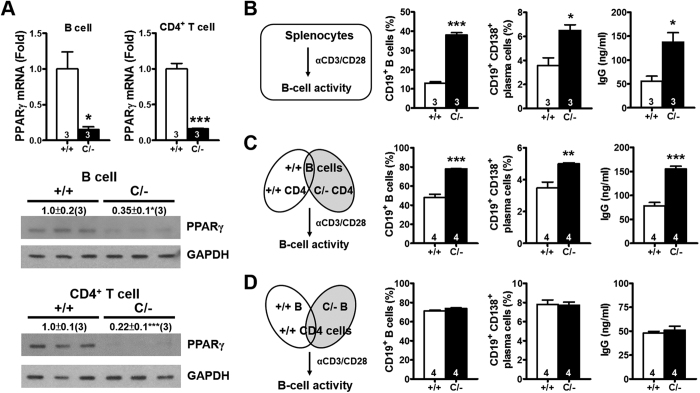
Figure 4. Increased B-cell activation by PPARγ hypomorphic effector T-helper cells.
(A) PPARγ mRNA and protein levels in B cells and CD4+ T cells from 3-mo-old mice. (B) Schematic of the splenocyte activation protocol. Percentages of B cells (CD19+) gating from lymphocytes and proliferating blast cells, percentages of plasma cells (CD19+ CD138+) gating from B cells (CD19+) measured by flow cytometry after anti-CD3/CD28 stimulation for 3 d, and IgG production in the medium measured after anti-CD3/CD28 stimulation for 7 d. (C) Coculture of WT B cells with WT or PpargC/− CD4+ T cells, the same parameters as in B were measured. (D) Coculture of WT CD4+ T cells with WT or PpargC/− B cells, the same parameters as in B were measured. Splenocytes, B cells and CD4+ T cells were isolated from 4–6-mo-old mice. Numbers inside bars or parentheses indicate the number for each group. *p < 0.05; **p < 0.01; ***p < 0.001.

