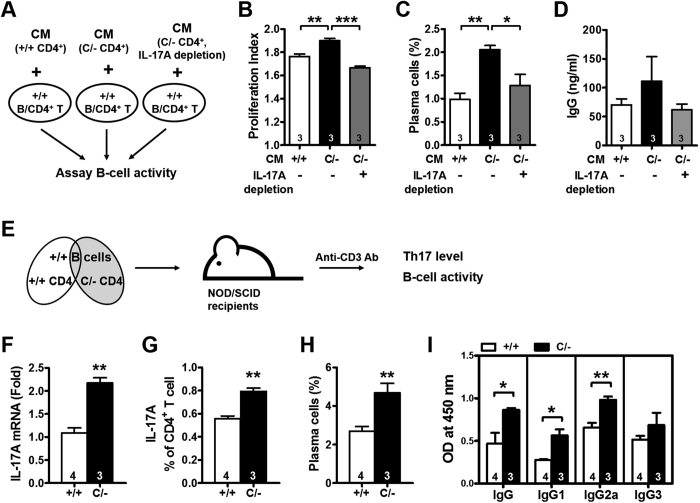
Figure 6. Increased B-cell activation by the IL-17 secreted from PPARγ hypomorphic CD4+ T cells.
(A) Schematic of the WT B-cell activation protocol. Incubation of B cells and CD4+ T cells (both from WT mice) with the conditioned medium (CM) from anti-CD3/CD28-activated WT and PpargC/− CD4+ T cells with or without IL-17A depletion. (B) B-cell proliferation was analyzed by flow cytometry and the proliferation index was quantified by FlowJo software. (C) Percentage of plasma cells and (D) IgG production were determined. B cells and CD4+ T cells were isolated from 4–6-mo-old mice. *p < 0.05; **p < 0.01; ***p < 0.001 by one-way ANOVA with Scheffe’s test for (B–D). (E) Schematic of the adoptive transfer protocol. WT or PpargC/− CD4+ T cells were mixed with WT B cells and transferred into NOD/SCID mice. The recipient mice were stimulated with anti-CD3 antibodies (40 μg/d) for 5 d and analyzed 11 d after the end of stimulation. (F) Relative expression of IL-17A in the splenic CD4+ T cells. (G) Splenic CD4+ T cells were assessed for IL-17A production after PMA/inomycin restimulation through intracellular staining. (H) Percentage of plasma cells in splenocytes measured by flow cytometry. (I) IgG, IgG1, IgG2a and IgG3 levels in the sera. Numbers inside bars indicate the number for each group. *p < 0.05 and **p < 0.01 by Student’s t test for (F–I).

