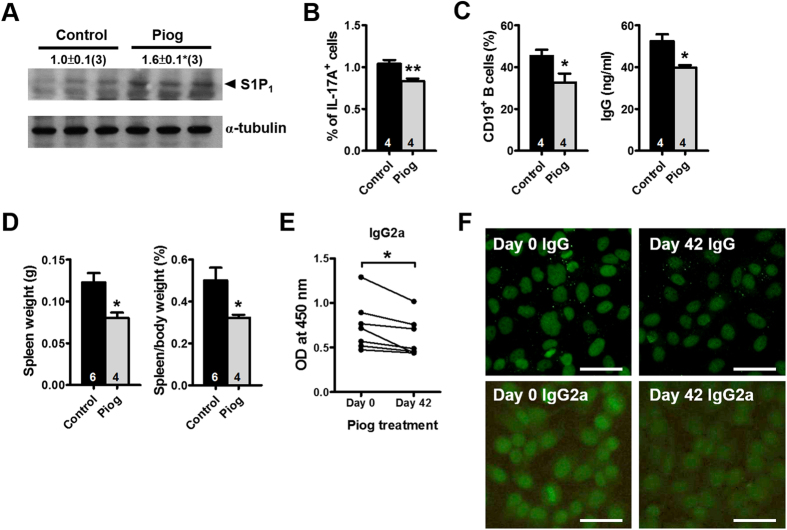
Figure 7. Effects of PPARγ activation in PPARγ hypomorphic mice.
(A) Immunoblotting of S1P1 and (B) percentage of IL-17A+ CD4+ T cells in the spleen of PpargC/− mice treated with 20 mg/kg/d pioglitazone (Piog) for 2 mo starting at 2 mo of age. (C) Percentage of CD19+ B cells and secreted IgG levels from the coculture of WT B-cells with CD4+ T cells from control and Piog-treated PpargC/− mice. (D) Spleen weight and spleen-to-body weight ratio in Piog-treated PpargC/− mice. (E) The IgG2a levels in and (F) HEp-2 cells stained for anti-nuclear antibodies (IgG and IgG2a) from the sera of PpargC/− mice treated with 60 mg/kg/d Piog for 6 wks starting at 14 mo of age. Numbers inside bars or parentheses indicate the number for each group. *p < 0.05 and **p < 0.01.

