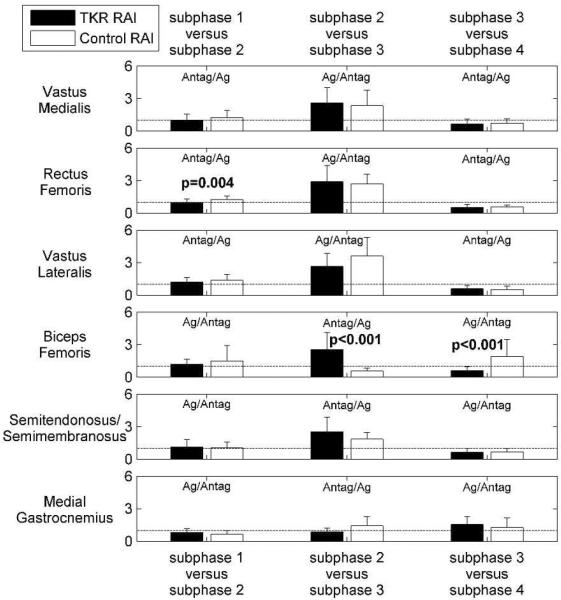
Figure 5.
Relative activation index (RAI) between subphases of stance for 19 TKR and 19 control subjects. A RAI value of one (dashed horizontal lines) means that the muscle activity in the earlier subphase is equal to the muscle activity in the later subphase of stance. P-values correspond to comparisons between the TKR and control subjects (Mann-Whitney U-tests).

