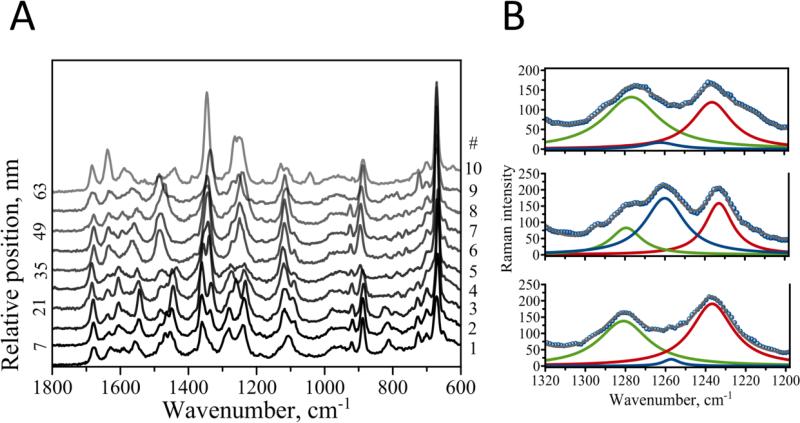
Figure 4.
A) Ten consecutive TERS spectra measured along the fibril formed at pH 5.6. B) Detailed analysis of amide III bands for the spectra at relative position 7 (bottom, spectrum #2), 14 (middle, spectrum #3) and 21 (top, spectrum #4) with the following color coding: α-helix (green), random coil/unordered (blue) and β-sheet (red).

