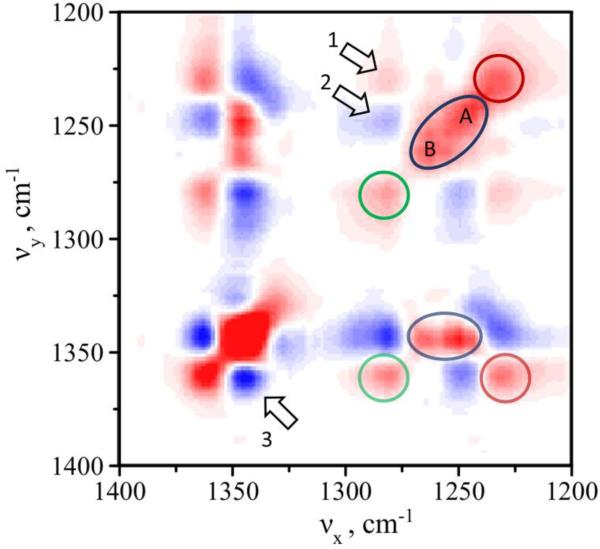
Figure 6.
2D synchronous map for amide III and Cα-H regions. Positive and negative regions are shown in red and blue, respectively. Diagonal autopeaks in the amide III region are indicated with the red circle for β-sheet secondary structure, green circle for α-helix and blue oval for unordered/random coil conformation. Similar representation was used for off-diagonal cross-peaks showing correlation between amide III and Cα-H. Arrows indicate correlation observed between peaks within the same region: 1) 1280/1235 cm−1, 2) 1280/1249 cm−1, and 3) 1360/1340 cm−1.

