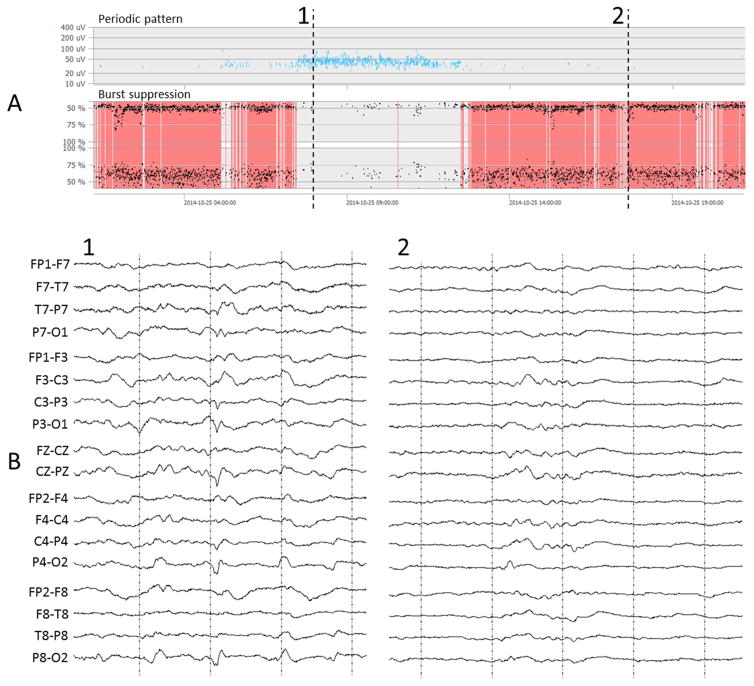
Fig. 1.
Quantitative EEG interface (NeuroTrend, www.encevis.com) showing the detection results of a 20 h EEG recording registered in the intensive care unit. (A) The upper plot show periodic pattern detections (Fürbass et al., 2015a) which are continuously present for approx. 5 h in this patient. The lower plot labeled “burst suppression” represents the automatically detected burst suppression patterns. (B) The EEG at time point 1 shows an example of a periodic pattern; the EEG at time point 2 gives an example of a burst suppression pattern.

