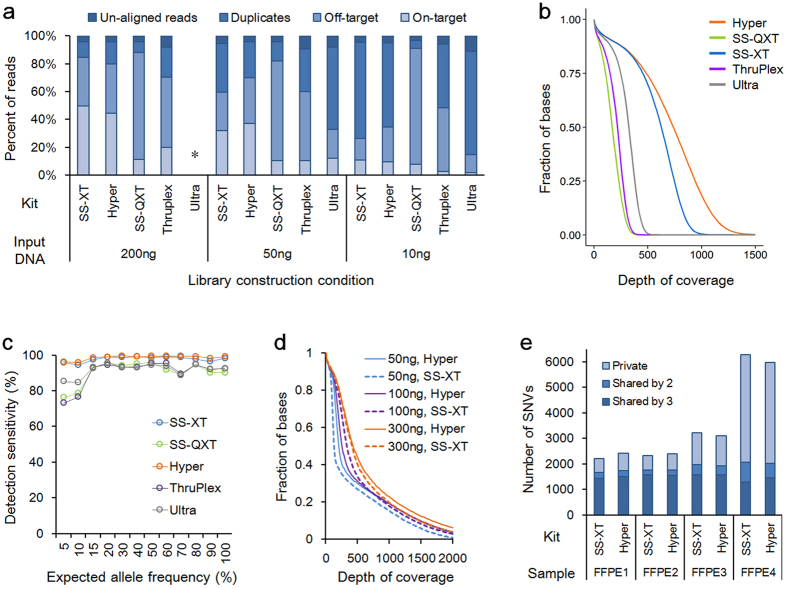
Figure 1.
Comparison of kits using HapMap cell line DNA (a–c) and FFPE samples (d,e). (a) Stacked bar plot showing subgroups of filtered reads and reads left after filtering (i.e., on-target) for five commercial kits using 200 ng, 50 ng, and 10 ng of input DNA. The NEBNext Ultra kit failed to construct an acceptable library using 200 ng of input DNA (indicated by an asterisk). (b) Coverage efficiency comparison using 50 ng of input DNA (n = 2). Coverage efficiency is visualized as the percent of the total targeted bases covered at particular depths. Data in (a,b) were averaged from two sets of libraries from two HapMap pools (10 cell lines each). (c) Base substitution detection sensitivity of libraries using 50 ng of input DNA was plotted against expected allele frequencies of base substitution alterations (x-axis). (d) Coverage efficiency comparison using an FFPE sample (FFPE1 in e). (e) Comparison of base substitution concordance among libraries from the same sample. For each of four samples, three libraries were generated using 300 ng, 100 ng, or 50 ng of input DNA. Depending on the number of libraries detecting a variant, variants were classified into three groups; private to a library, shared by two libraries, or found in three libraries.

