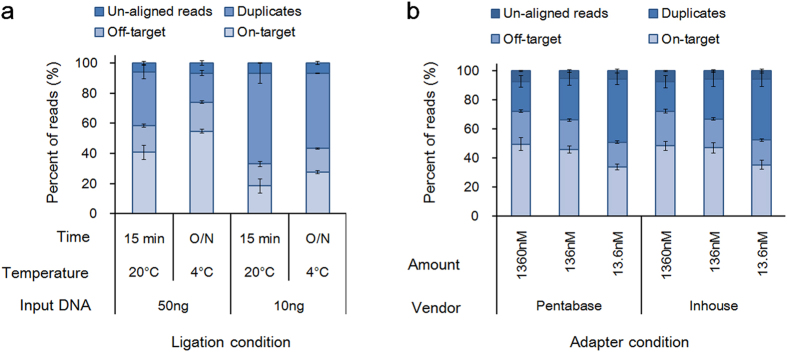
Figure 2. Optimization of adapter ligation. Stacked bar plot showing subgroups of filtered reads and reads left after filtering (i.e., on-target) for each condition.
(a) Effect of ligation temperature. Ligation using 50 ng or 10 ng of input DNA was performed in duplicate either at 25 °C for 15 min or 4 °C overnight. (b) Effect of adapter concentration. Values are expressed as mean ± s.e.m. (n = 3).

