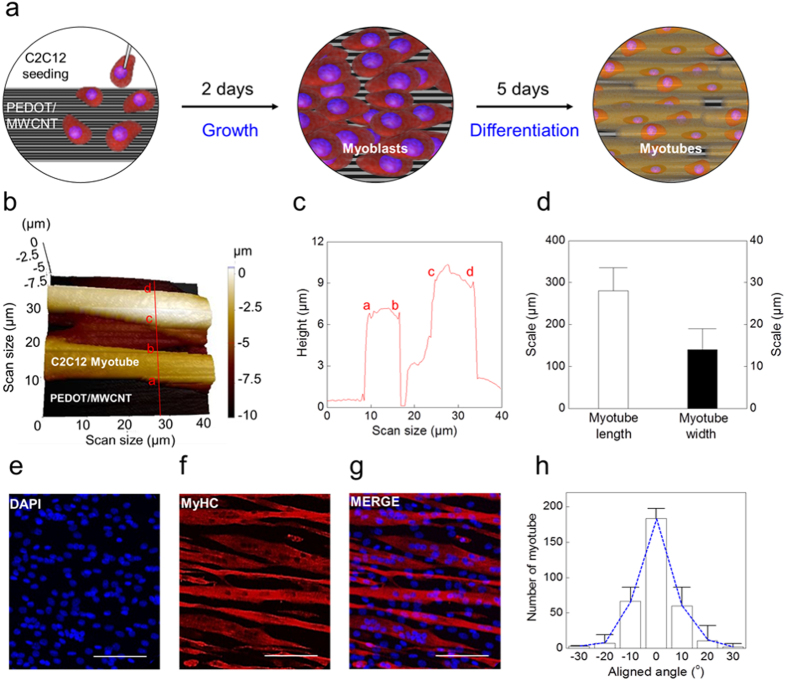
Figure 1. PEDOT/MWCNT-based cell culture platform and analysis of myotube alignment.
(a) Schematic illustration of the cell culture protocol. (Left) C2C12 myoblasts seeded on a PEDOT/MWCNT sheet. (Middle) 2 days of cell culture. (Right) Aligned myotubes after 7 days of differentiation. (b) Scanning ion-conductance microscope (SICM) 3D image of the myotubes on the PEDOT/MWCNT sheet. The scan area is 40 × 40 μm. (c) Myotube width and height profiles were obtained from the cross-sectional line profile shown in (b). Each letter on the line profile corresponds to the same letter on the cross-section of (b). (d) The average myotube length and width were obtained from confocal microscope images of MyHC+ myotubes. (e–g) Confocal microscope images of MyHC+ myotubes grown on a PEDOT/MWCNT sheet. Scale bar = 50 μm. (h) Myotube alignment ratio analyzed by constructing an angular spread distribution histogram (n = 200). 93% of the myotubes were positioned in the range of −10° to +10°.

