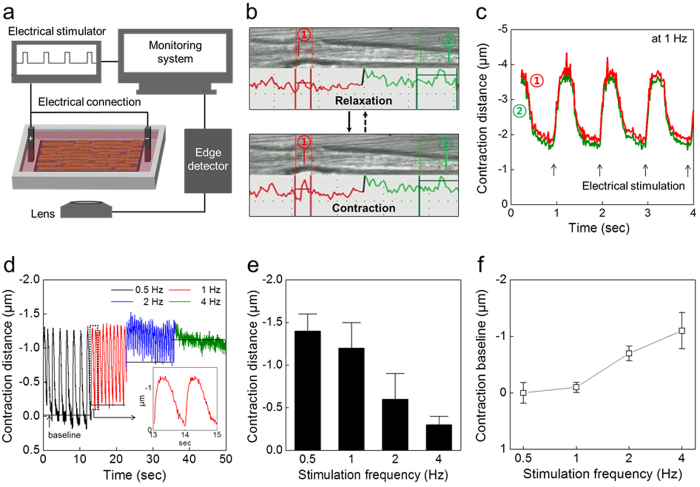
Figure 2. Single myotube contraction.
(a) Schematic diagram of the device with an edge-detection system and electric field stimulation (EFS) for tracing contraction and relaxation. (b) Snapshot images from the monitoring system when a myotube relaxes and contracts. Red and green lines the indicate line scan profile of the left and right sides, respectively, of a single myotube. (c) Contraction distance changes of a single myotube at 1 Hz EFS. Red and green lines correspond to the movement of (1) and (2) indicated in (b). The average distance is 1.3 μm at 1 Hz EFS. (d) The frequency-contraction distance relationship in response to varying EFS frequencies. The inset shows the enlarged signal recorded at 1 Hz EFS. (e) Contraction distances were measured at each EFS frequency (1.4 ± 0.2 μm at 0.5 Hz; 1.2 ± 0.3 μm at 1 Hz; 0.6 ± 0.3 μm at 2 Hz; 0.3 ± 0.1 μm at 4 Hz; n = 500). (f) Baseline movement is increased as EFS frequency increases.

