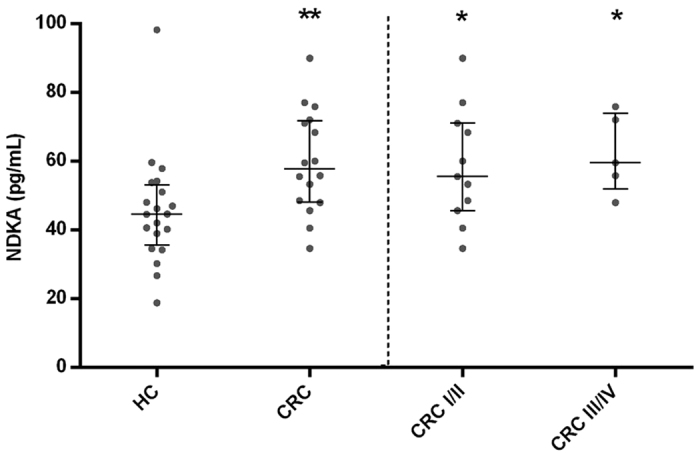
Figure 1. Scatterplot representation of serum NDKA levels in the case-control cohort.

Lines represent median values and whiskers indicate the interquartile range. HC: healthy controls; CRC: colorectal cancer; I/II: stage I and II; III/IV: stage III and IV; *p < 0.05 and **p < 0.01 for comparisons of NDKA levels with healthy controls (Mann-Whitney U test).
