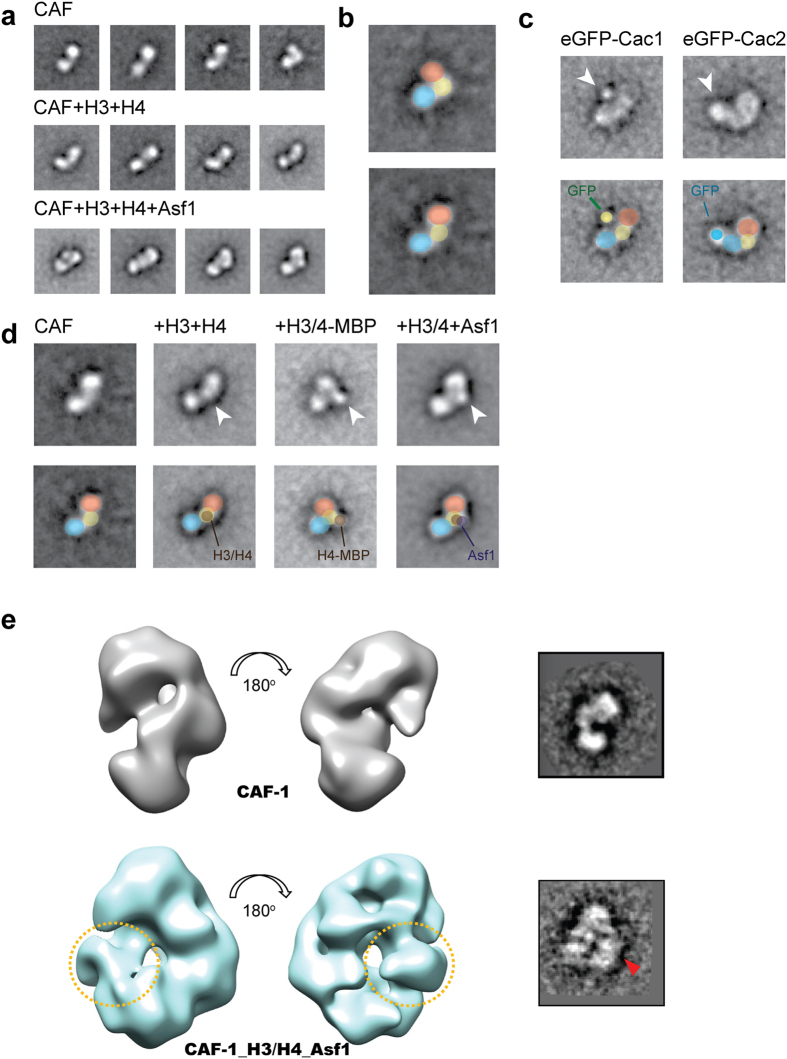
Figure 3. Single-particle electron microscopy (EM) analysis of the yCAF-1 complex.
(a) Representative class averages of negatively stained, GraFix stabilized yCAF-1, yCAF-1_H3/H4, and yCAF-1_H3/H4_Asf1 complexes. (b) Proposed organization of the 2D class average into three distinct regions marked with different colors. (c) Localization of the relative positions of Cac1 and Cac2. yCAF-1 with Cac1 or Cac2 fused to N-terminal eGFP tags were visualized. Additional density compared to the untagged complex are marked by white arrowheads. (d) Localization of H3/H4 and Asf1 binding. Additional density in the complexes containing H3/H4 and Asf1 compared to yCAF-1 alone are denoted by white arrowheads. +H3/4-MBP corresponds to yCAF-1 complex with histone H3 and the N-terminal 20 residues of histone H4 fused to maltose binding protein. (e) 3D reconstructed EM structures of CAF-1 alone and CAF-1_H3/H4_Asf1. Two different views with 180° rotation are shown in right panel for CAF-1 alone (upper left) and CAF-1_H3/H4_Asf1 (lower left). The extra-density corresponding to H3/H4_Asf1 is indicated by yellow dotted circles. 2D class averages corresponding to the view of 3D reconstructions are shown in the right panels and the position of H3/H4_Asf1 is indicated by a red triangle.

