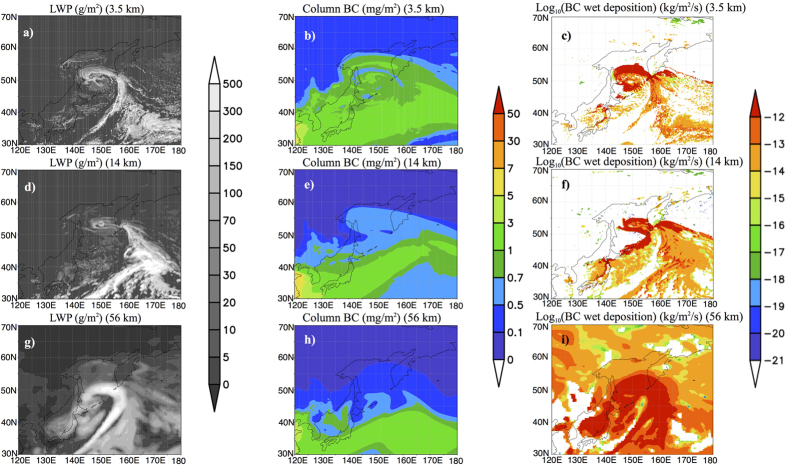
Figure 1. Differences in the structure of a low and frontal system, and black carbon aerosol (BCA) transport for model simulations using different grid resolutions.
(a,d,g) Example of frontal systems and lows visualised by the vertically accumulated mass of liquid water (liquid water path: LWP) (g m−2) at 21UTC on 20111124 over Japan; (b,e,h) black carbon aerosol (BCA) transport by the lows and frontal systems shown by the vertically accumulated BCA (column BCA) (mg m−2); and (c,f,i) wet deposition flux of BCA at the same time. (a–c), (d–f), and (g–i) indicate the results of the simulation at 3.5-, 14-, and 56-km resolution, respectively. The mapping of the figures was created using the Grid Analysis and Display System (GrADS)51 version 2.1.a1.

