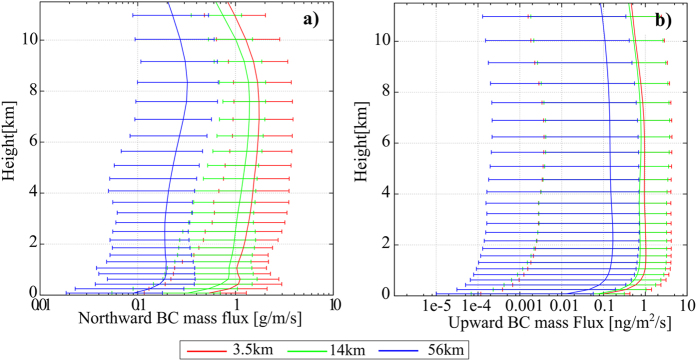
Figure 3. Vertical profile of the northward and upward black carbon aerosol (BCA) mass flux by lows and frontal systems.
The vertical profile of the (a) zonally accumulated poleward BCA mass flux across 60°N and (b) horizontally averaged upward BCA mass flux around lows and frontal systems, simulated with (red) 3.5-km, (green) 14-km, and (blue) 56-km horizontal grid resolution, and averaged during the final 10 days of the simulation. The whiskers of each plot show the range from 5th to 95th percentile. The method used to extract lows and frontal systems were based on the previous study27.

