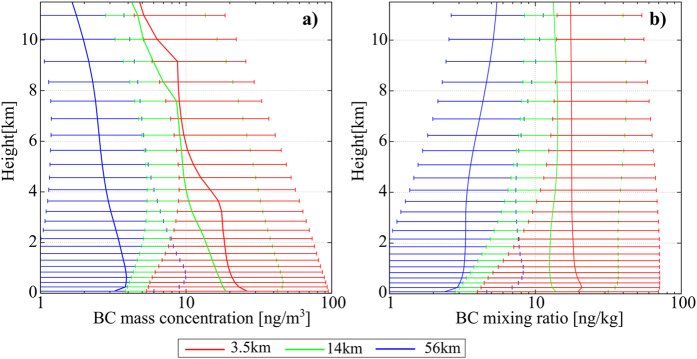
Figure 6. Vertical profile of the black carbon aerosol (BCA).
Vertical profile of (a) BCA mass concentration and (b) mixing ratio of BCA averaged over the Arctic region, simulated with (red) 3.5-km, (green) 14-km, and (blue) 56-km horizontal grid resolution, and averaged during the final 10 days of the simulation. The whiskers of each plot show the range from the 5th to 95th percentile.

