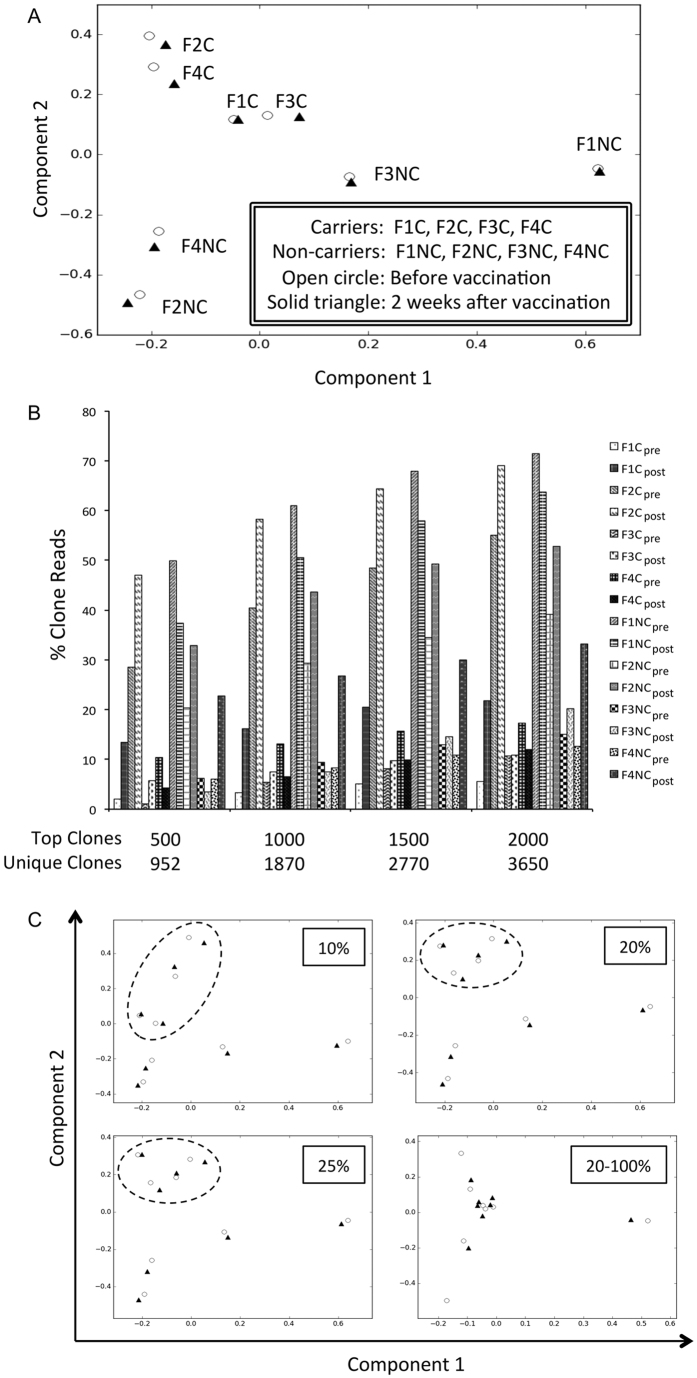
Figure 2. Principal component analysis of IgG immune repertoires.
(A) Samples from carriers were grouped together. Non-carriers were shown separately. Open circles denote repertoires before vaccination. Solid triangles denote those after vaccination. Repertoires from the same individual were always close to each other, but repertoires between siblings were distant. (B) Clones that contributed most to the principal component analysis were also the most abundant. Among the top 500 clones from both components over half of the 16 samples consisted of more than 10% of reads for these sequences. The most significant 3,650 unique CDR-H3s, which comprised merely 0.15% of all clones, trended to accumulate more than one-tenth of reads for every repertoire except one. Over half of the reads of five samples were accountable by these supporting sequences. (C) The most abundant 10% of clones were suboptimal in grouping the carrier samples (dotted oval). However the most abundant 20% or 25% of the clones could clearly distinguish the carriers. The trailing 20–100% of clones failed to differentiate the repertoires of carriers from non-carriers.

