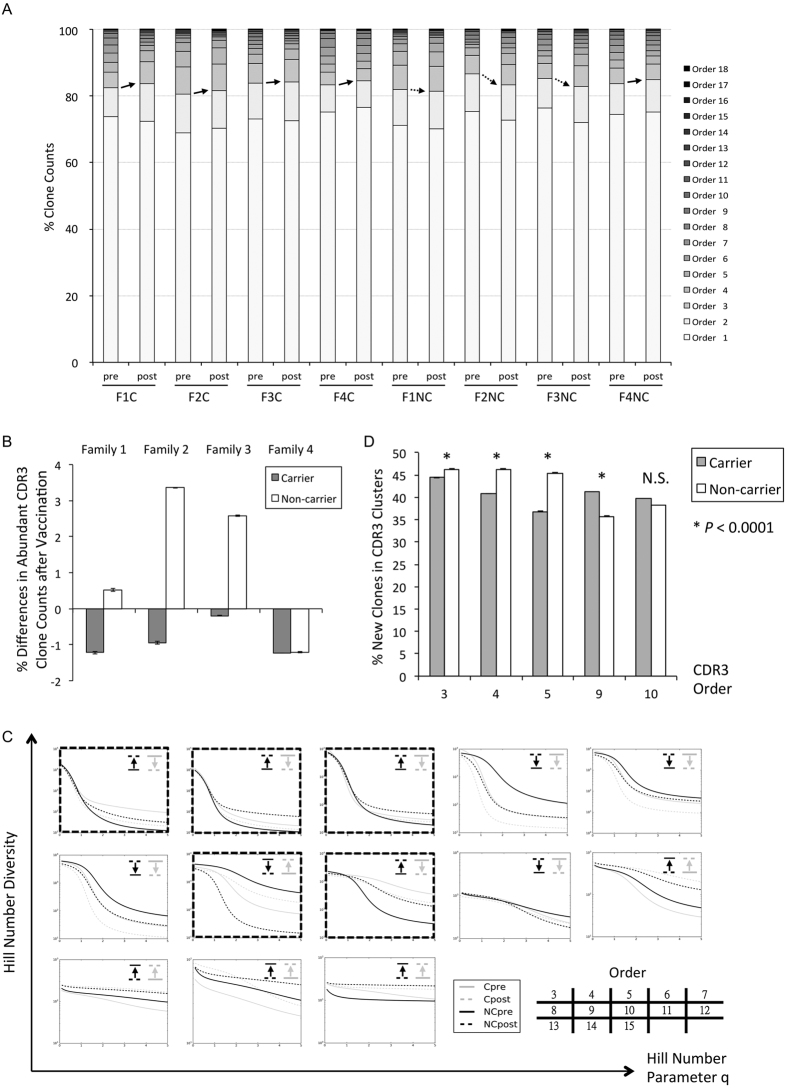
Figure 4. Changes in clonal diversity with vaccination.
(A) Clone counts in order 3 or higher decreased after vaccination for all the carriers. In contrast, they tended to increase among the non-carriers. The results are shown as the average of 10 rarefactions. (B) There was about a 1% decrease of clone counts in order 3 or higher for carriers. This was universal for all rarefaction datasets. This tendency was instead increased for most non-carriers. Error bars show the standard errors, Student’s t-test p < 0.05. (C) Diversities of CDR-H3 clusters connected with indel-free Hamming distance 1 in each order were profiled in Hill numbers. Vaccination-induced trends with parameter 2 or above distinguished carriers from non-carriers within order 3, 4, 5, 9, and 10. In order 9 carriers exhibited a positive shift after vaccination. However non-carriers had increased diversities in order 3, 4, 5, and 10. A typical result is shown from one rarefaction dataset. (D) Percentages of new clones in post-vaccination CDR-H3 clusters belonging to the five mid-abundance orders were calculated. Non-carriers had a significantly higher percentage in order 3, 4, and 5. Carriers had more new clones in order 9 (p < 0.0001 in Student’s t-Test for all rarefactions). The difference in order 10 was insignificant. The greatest contrast was noted for order 5.

