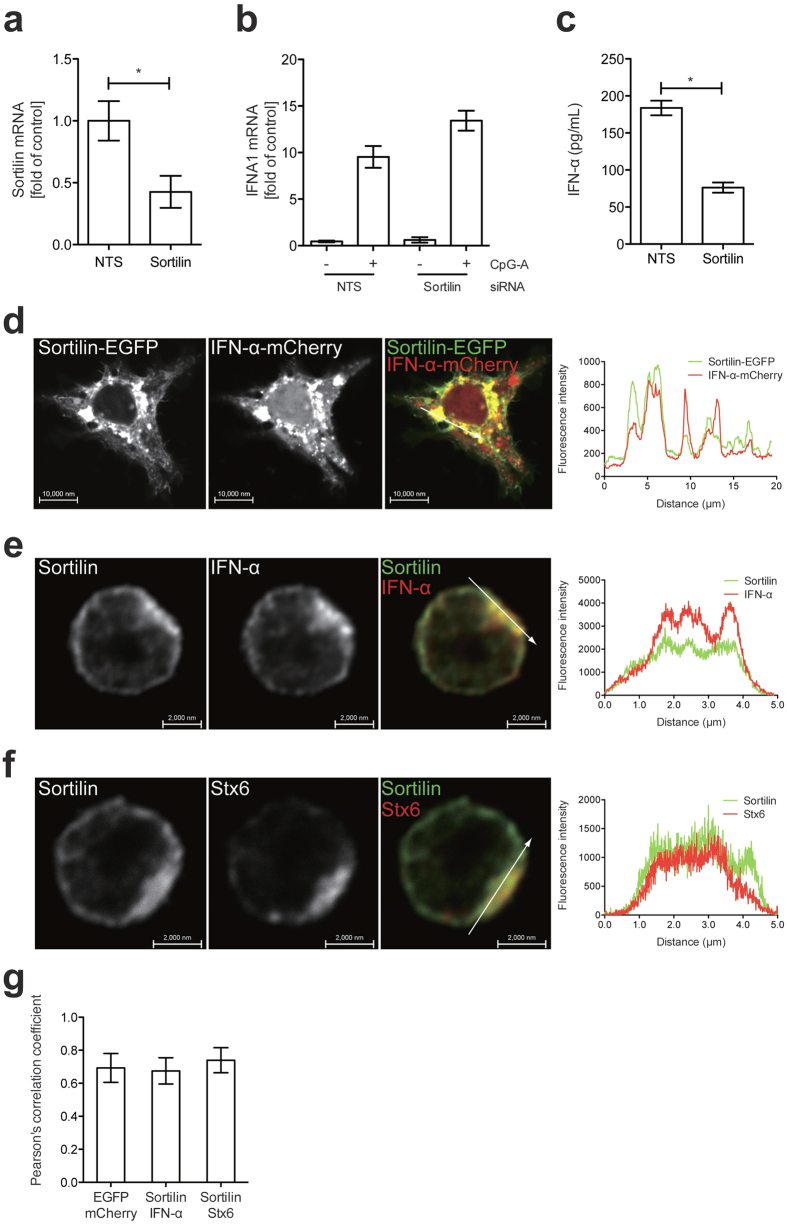
Figure 3. Sortilin is involved in IFN-α secretion in pDCs.
(a) Confirmation by qRT-PCR of siRNA knockdown efficiency of sortilin in pDCs. Data are mean ± SD (n = 3). *p < 0.01. (b) Quantification of IFNA1 mRNA after sortilin knockdown. Sortilin siRNA or non-targeting sequence (NTS) siRNA (both 300 nM) was introduced into pDCs by nucleofection for 24 h. Total RNA was isolated after 6 h of incubation with CpG-A, and IFNA1 mRNA was quantified by qRT-PCR. Data are mean ± SD (n = 3). (c) Quantification of IFN-α secretion by ELISA. Sortilin siRNA or NTS siRNA (both 300 nM) was introduced into pDCs by nucleofection for 24 h. The cell culture supernatant was collected after 18 h of incubation with CpG-A, and secreted IFN-α was quantified by ELISA. Data are mean ± SD (n = 4). *p < 0.01. (d) Confocal microscopy of sortilin-EGFP and IFN-α-mCherry in HEK293T cells. Plasmids pEGFP-Sortilin and pmCherry-IFNA2 were simultaneously introduced into HEK293T cells. (e) Confocal microscopy of sortilin and IFN-α in pDCs. pDCs were stimulated with 3 μM of CpG-A for induction of IFN-α. Endogenous sortilin and IFN-α were detected by indirect immunofluorescence analysis with specific antibodies. (f) Confocal microscopy of sortilin and syntaxin 6 (Stx6) in pDCs. Endogenous sortilin and Stx6 were detected by indirect immunofluorescence analysis with specific antibodies. All microscopic images were obtained with a laser scanning microscope and analyzed with ZEN 2010 software (Carl Zeiss). The linescan analysis (right panels of d–f) was performed with ZEN2010 software (Carl Zeiss) White arrows represent the direction and distance of the track of the linescan. (g) Pearson’s correlation coefficients of images of sortilin-EGFP and IFN-α-mCherry in HEK293T cells (left), sortilin (DyLight 488) and IFN-α (DyLight 649) in pDCs (middle) or sortilin (DyLight 488) and Stx6 (DyLight 649) in pDCs (right). Data are mean ± SD (n = 30).

