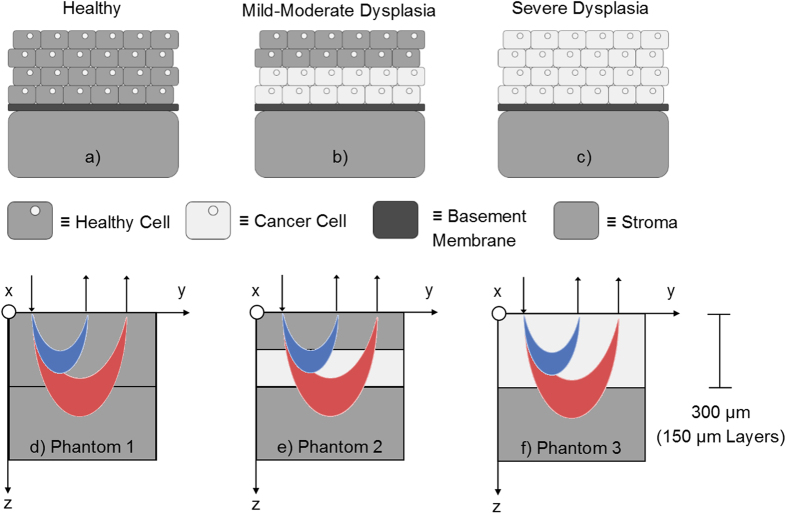
Figure 4.
A simplified representation of dysplastic proliferation arising at the basement membrane in the oral cavity (a–c) showing normal cells (gray with nuclei), dysplastic cells (light gray with nuclei), basement membrane (dark gray), and the stroma (gray). The associated dysplasia-mimicking phantom models (d–f) simulate this progression. Two SDSs (374 and 730 μm) deliver and collect broadband light at different depths (detected photons shown here as blue and red crescents, respectively). Each of thin phantom layers was 150 μm thick for a total phantom thickness of 300 μm to simulate the thickness of oral epithelium.

