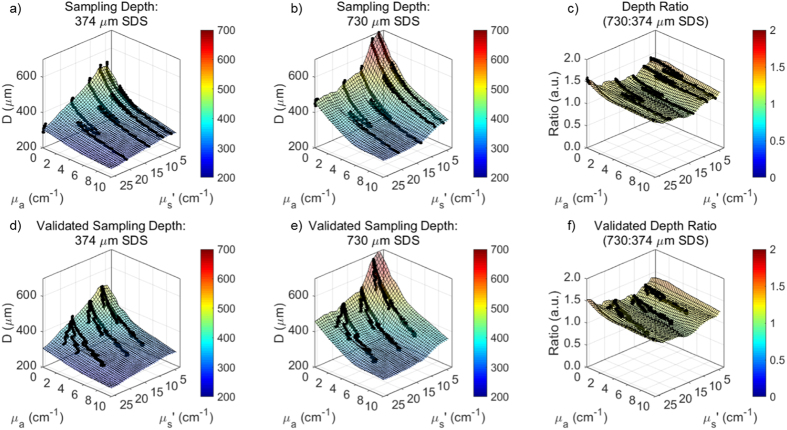
Figure 8.
100% (μs′ = 5–26 cm−1, μa = 0–10 cm−1) of both sampling depth LUTs were validated with acceptable percent errors much less than 10%. (a,b) Sampling depth LUTs were interpolated with raw data from calibration phantoms and (c) shows a ratio (1.2×) of the 730 μm SDS to 374 μm SDS sampling depths. (d,e) Sampling depths LUTs were validated with raw data from the bovine hemoglobin-based validation phantoms and (f) shows the validated ratio of the 730 μm SDS to 374 μm SDS sampling depths.

