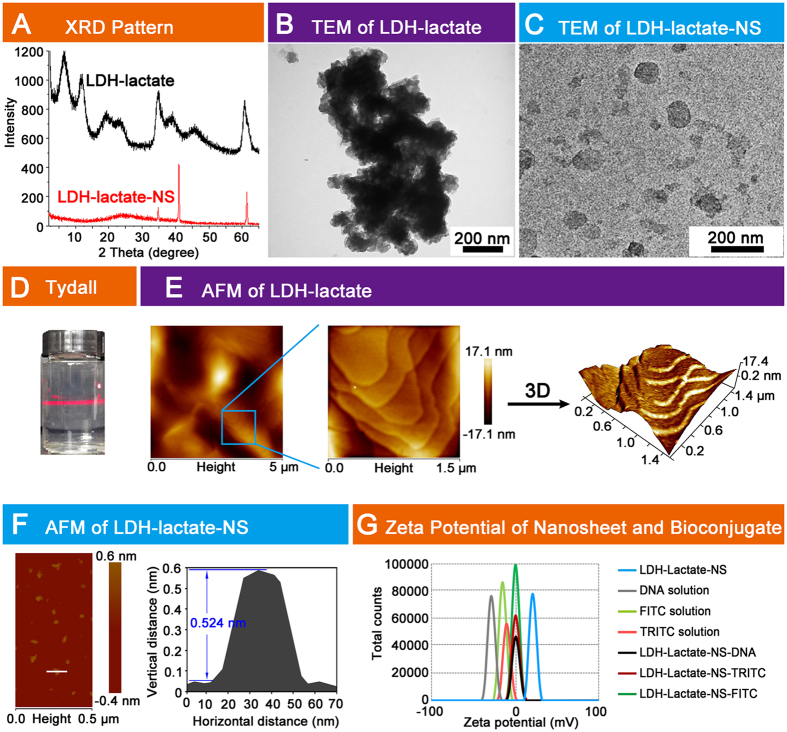
Figure 1. Characterization LDH-lactate and LDH-lactate-NS.
(A) XRD patterns of LDH-lactate and LDH-lactate-NS; (B) TEM image of LDH-lactate; (C) TEM image of LDH-lactate-NS; (D) Tyndall effects of LDH-lactate-NS; (E) Left: overview AFM image of LDH-lactate. Middle: amplified field in the box. Right: three-dimensional image of amplified field; (F) Left: AFM image of delaminated LDH-lactate-NS, color bar indicates the vertical distance. Right: The vertical distance and horizontal distance of a LDH-lactate-NS marked with white line was measured and showed; (G) Zeta potential of DNA solution, LDH-lactate-NS, TRITC, FITC, LDH-lactate-NS-TRITC, LDH-lactate-NS-FITC, and LDH-lactate-NS-DNA suspension.

