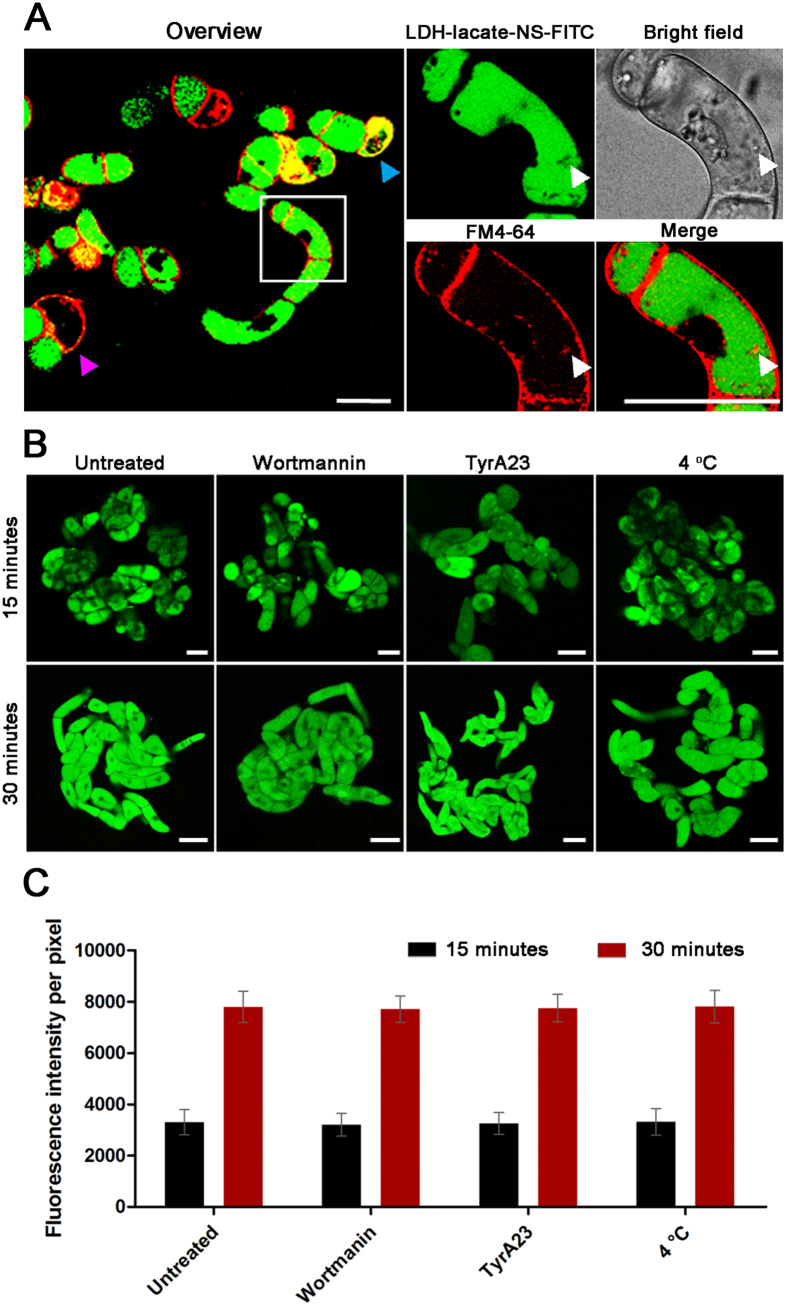
Figure 3. Investigation of the internalization pathways of LDH-lactate-NS in BY-2 cells.
(A) Confocal images of BY-2 cells treated with LDH-lactate-NS-FITC followed with FM4-64 staining. The membrane integrity-destroyed BY-2 cell was marked with cyan triangle, and the magenta triangle represents the cell that non-internalization of LDH-lactate-NS-FITC. The white triangle indicate vesicle-like spots caused by endocytosis of FM4-64; (B) Wild type BY-2 cells (pretreated with wortmannin, tyrA23, 4 °C) incubated in 1/2 MS medium containing LDH-lactate-NS-TRITC; (C) The column chart present the mean fluorescence intensities that expressed as means ± standard deviation (SD, n = 150 cells in three independent replications). Scale bars = 50 μm.

