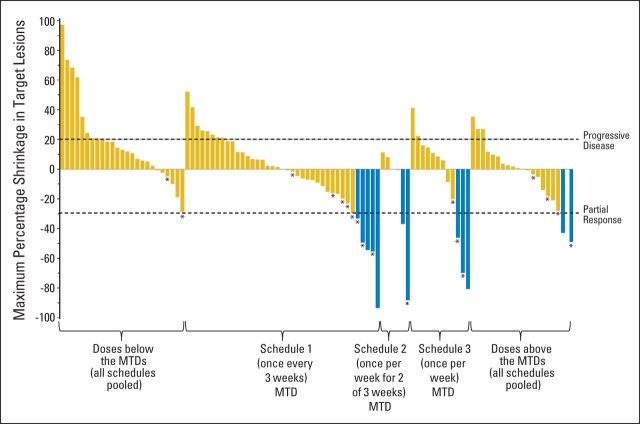
Fig 2.
Antitumor responses. The best response (represented by shrinkage in RECIST target lesions) is shown for each patient with postbaseline evaluation of all target lesions. Blue bars indicate patients achieving partial response; asterisks indicate patients with response or stable disease for > 6 months. MTD, maximum-tolerated dose.

