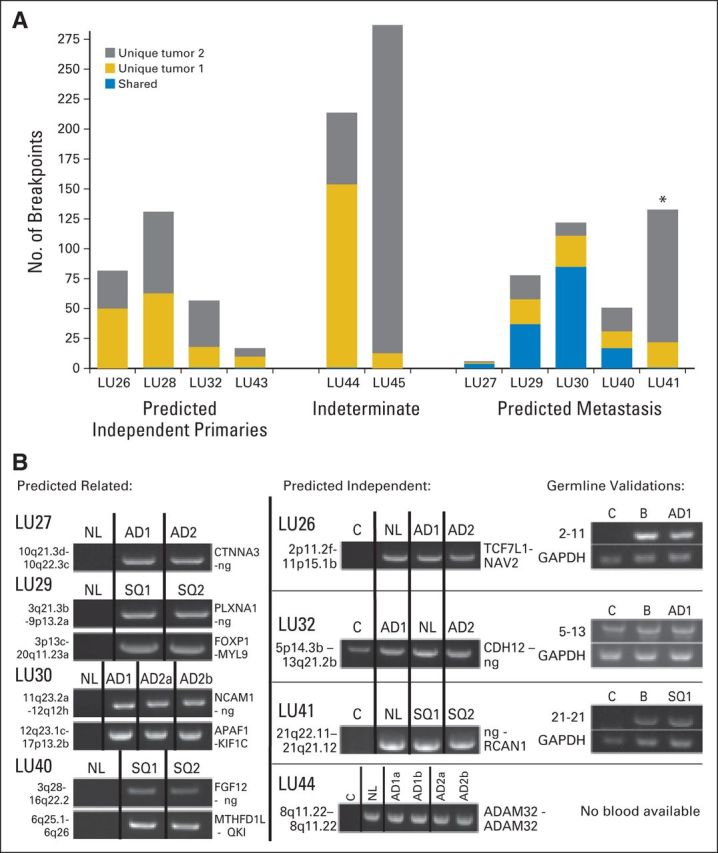
Fig 5.

Breakpoint numbers and polymerase chain reaction (PCR) validations of tumor pairs from the study group. (A) Numbers of genomic breakpoints detected in each tumor pair (y-axis). Total numbers of breakpoint events are listed as unique to either tumor 1 (AD1 or SQ1; gold) or tumor 2 (AD2 or SQ2; gray) of the tumor pairs or shared between both tumors (blue). (B) PCR validation bands of selected breakpoint events on samples predicted as related (left panels) or independent (central panels). PCR on non-neoplastic lung tissue from the same patient (NL) and a mixed-population independent genomic DNA control (C) were also run on the same agarose gels (1%). Germline validations on patient-derived blood DNA (B) are presented in the right panel, together with glyceraldehyde 3-phosphate dehydrogenase (GAPDH) controls. AD, adenocarcinoma; ng, no gene involved; SQ, squamous cell carcinoma. (*) Indicates the discrepant case, LU41, where the genomic and clinical predictions are discordant.
