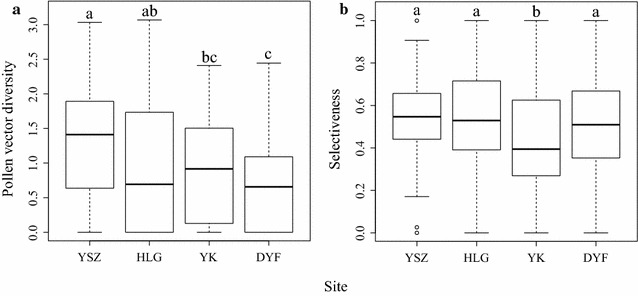
Fig. 1.

Boxplots of plant specialization indices at different communities on the Yulong Mountain, SW China. YSZ 2725 m above sea level; HLG 3235 m above sea level; YK 3670 m above sea level; DYF 3910 m above sea level. The bottom and top limits of each box are the lower and upper quartiles, respectively. The horizontal black lines across boxes are medians. Error bars represent the 95 % confidence interval of the median. a Pollen vector diversity (Shannon’s diversity index); b selectiveness (d’ index)
