
Table 2.
Most relevant sirtuin inhibitors
| Compound | Structure | Enzyme activity | Biological Effects | Reference(s) |
|---|---|---|---|---|
|
1
,
splitomicin |
|
ySir2 IC50 = 60 μM SIRT1: no inhibition @500 μM |
Minimal inhibitory concentration (MIC) in yeast of 0.49 μM. | [37] |
|
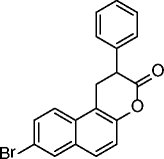
2, HR-73 |
|
SIRT1 IC50 = < 5 μM | Decreased HIV transcription through viral Tat protein acetylation. | [38] |
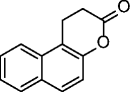
| 3, 4 |

|
3 SIRT2 IC50 = 1.5 μM 4 SIRT2 IC50 = 1.5 μM (racemate) SIRT2 IC50 = 1.0 μM (R enantiomer) |
Weak antiproliferative effects and increased α-tubulin acetylation in MCF-7 breast cancer cells. | [39] |
|
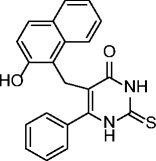
5, EX-527, selisistat |
|
SIRT1 IC50 = 0.098 μM SIRT2 IC50 = 19.6 μM SIRT3 IC50 = 48.7 μM |
Induction of p53 acetylation in different cell lines. Modulation of the acetylation status of the mutant huntingtin via SIRT1 inhbition shown to restore transcriptional dysregulation in models of Huntington’s disease (HD) treatment. In a first Phase II clinical trial found to be safe and well tolerated in early stage HD patients at plasma levels within the therapeutic concentration range in preclinical HD models. |
[40–44] |
|
6, cambinol |
|
SIRT1 IC50 = 56 μM SIRT2 IC50 = 59 μM SIRT3: no inhibition @300 μM SIRT5: 42% inhibition @300 μM |
Induces apoptosis in BCL6-expressing Burkitt lymphoma cells. Reduces tumor growth of Burkitt lymphoma in a mouse xenograft model. Reduces neuroblastoma formation in N-Myc transgenic mice. |
[45–50] |
|
7, AGK2 |
|
SIRT1 IC50 > 50 μM SIRT2 IC50 = 3.5 μM SIRT3 IC50 > 50 μM |
Protective against Parkinson’s disease (PD) in different PD models. Induces caspase-3-dependent apoptosis and necrosis of C6 glioma cells. |
[24, 51] |
|
8, tenovin-1 9, tenovin-6 |

|
Tenovin-1: IC50s not determined due to lack of water solubility Tenovin-6: SIRT1 IC50 = 21 μM SIRT2 IC50 = 10 μM SIRT3 IC50 = 67 μM |
Tenovin-6
Cytotoxic to the ARN8 melanoma cells. Delayes the growth of xenograft tumors derived from ARN8 cells. Decelerates the disease progression of chronic myelogenous leukemia in mice model. Potent antitumor activity in various human gastric cancer cells via death receptor 5 (DR5) upregulation. |
[52–54] |
|
10, sirtinol |

|
ySir2 IC50 = 70 μM SIRT1 IC50 = 131 μM SIRT2 IC50 = 49 μM |
Inhibits the viability of MCF-7, H1299, DU145, PC3 and HeLa cells. Enhances the chemosensitivity to camptothecin and cisplatin in DU145, PC3 and HeLa cells. Promotes a signifcant growth inhibition or apoptosis in cells from adult T-cell leukemia-lymphoma (ATL) and HTLV-1-related cell lines. |
[55–59] |
|
11, salermide |
|
SIRT1 IC50 = 43 μM SIRT2 IC50 = 25 μM |
Induces apoptosis in various cancer lines (mainly MOLT4, KG1A, SW480, and Raji) but not in normal cells (MRC5) through inhibition of SIRT1 in a p53-independent manner. Induces apoptosis in NSCLC cells through upregulation of CDR5. Exerts potent antiproliferative effects on MOLT4, MDA-MB-231 and RKO cancer cells and in colorectal carcinoma (CRC) and glioblastoma multiforme (GBM) cancer stem cells (CSCs). Exerts cell protection effects in a C. elegans model of muscular dystrophy. Induces apoptosis and death of schistosomula, separation of adult worm pairs and reduction in egg laying, through inhibition of the S. mansoni specific sirtuin |
[60–64] |
|
12, MC2141 |
|
SIRT1 IC50 = 9.8 μM SIRT2 IC50 = 12.3 μM |
Induces apoptosis in U937 cells. Exerts significant antiproliferative effects on Raji , DLD1, HeLa, and CRC and GBM CSCs. |
[65, 66] |
|
13, inauhzin |
|
SIRT1 IC50 = 0.7- 2 μM SIRT2: no inhibition @50 μM SIRT3: no inhibition @50 μM |
Activates and stabilizes p53 by inhibiting SIRT1 activity with consequent p53 acetylation and prevention of MDM2-mediated p53 ubiquitylation. Inhibits cell proliferation and promotes senescence and tumor-specific p53-dependent apoptosis without genotoxicity in different cell lines (mainly H460, HCT116, and A549 cells). Represses the growth of xenograft tumors derived from p53-harbouring H460 and HCT116 cells. |
[67] |
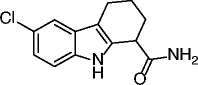
| 14 |
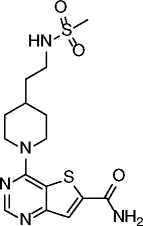
|
SIRT1 IC50 = 4 nM SIRT2 IC50 = 1 nM SIRT3 IC50 = 7 nM |
Not reported | [68] |
|
15, SirReal2 |
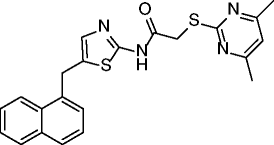
|
SIRT2 IC50 = 0.14-0.44 μM SIRT1 22% inhibition @100 μM SIRT3 no inhibition @100 μM SIRT4 no inhibition @200 μM SIRT5 no inhibition @200 μM SIRT6 19% inhibition @200 μM |
Hyperacetylation of α-tubulin and of the microtubule network in HeLa cells (@20 μM). Significant depletion of the SIRT2 substrate BubR1 (spindle assembly checkpoint protein) in HeLa cells. No alteration of cell cycle distribution in HeLa cells. |
[69] |
| 16-20 |
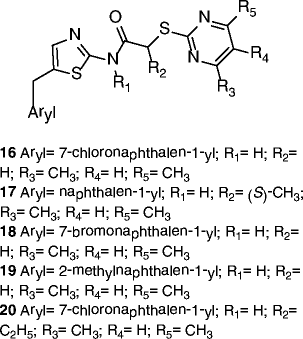
|
16 SIRT2 IC50 = 0.18 μM SIRT1 29% inhibition @200 μM 17 SIRT2 IC50 = 0.26 μM SIRT1 no inhibition @200 μM 18 SIRT2 IC50 = 0.21 μM SIRT1 no inhibition @200 μM 19 SIRT2 IC50 = 0.31 μM SIRT1 no inhibition @200 μM 20 SIRT2 IC50 = 0.32 μM SIRT1 no inhibition @200 μM |
Hyperacetylation of α-tubulin and of the microtubule network in HeLa cells (16 @10 μM). | [70] |
| 21 |
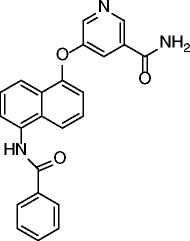
|
SIRT2 IC50 = 48.3 nM SIRT1 IC50 = 12 μM SIRT3 IC50 = 44.2 μM |
Time-dependent and dose-dependent hyperacetylation of α-tubulin in MCF-7 cells. Modest cytotoxic effects (CC50 26-33μM) in human cancer cell lines (MCF-7, K562 and DU145). |
[71] |
| 22, 23 |
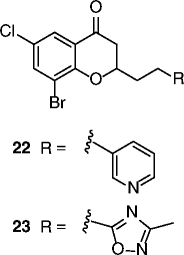
|
22 SIRT2 IC50 = 3.7 μM 23 SIRT2 IC50 = 12.2 μM SIRT1/3 no inhibition @200 μM for both compounds |
Dose-dependent hyperacetylation of α-tubulin in MCF-7 cells. Dose-dependent antiproliferative effects on MCF-7 and A549 cancer cells. |
[72, 73] |
|
24, AK-7 |
|
SIRT2 IC50 = 15.5 μM SIRT1/3 no inhibition @50 μM |
Neuroprotective reduction of total neuronal cholesterol biosynthesis in a SIRT2 inhibition-dependent way. Neuroprotective effects in different models of Huntington’s disease and Parkinson’s disease. |
[74–76] |
|
25, SDX-437 |
|
SIRT3 IC50 = 700 nM SIRT1 no inhibition @100 μM |
Not reported. | [77] |
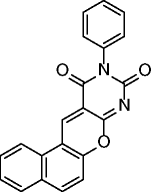
| 26 |
|
SIRT6 IC50 = 89 μM SIRT1 IC50 = 1578 μM SIRT2 IC50 = 751 μM |
Hyperacetylation of SIRT6 substrate H3K9 in pancreatic adenocarcinoma BxPC-3 cells. Glucose uptake increase, dose-dependent upregulation of GLUT-1 expression and reduction of TNF-α secretion in BxPC-3 cells. |
[78] |
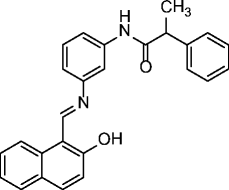
| 27, 28 |
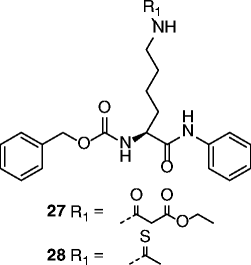
|
27 SIRT1 IC50 = 3.9 μM 28 SIRT1 IC50 = 2.7 μM SIRT2 IC50 = 23 μM SIRT3 IC50 > 100 μM |
Not reported. | [84, 85] |
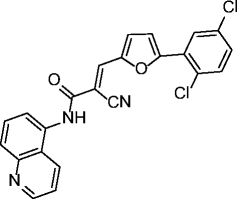
| 29 |
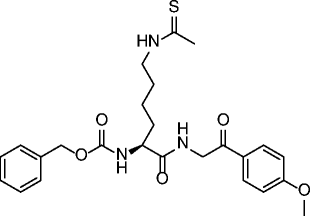
|
SIRT1 IC50 = 0.9 μM SIRT2 IC50 = 3 μM SIRT3 IC50 = 8 μM |
Antiproliferative effect in A549 lung carcinoma and MCF-7 breast carcinoma cell lines. | [86, 87] |
| 30 |
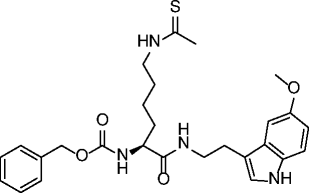
|
SIRT1 IC50 = 6 μM SIRT2 IC50 = 26 μM SIRT3 IC50 = 29 μM |
Antiproliferative effect in A549 lung carcinoma and MCF-7 breast carcinoma cell lines. | [86, 87] |
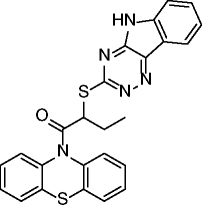
| 31-33 |

|
31 SIRT1 IC50 = 11 μM SIRT2 IC50 = 77 μM 32 SIRT1 IC50 = 12 μM SIRT2 IC50 = 30 μM 33 SIRT1 IC50 = 0.7 μM SIRT2 IC50 = 4 μM |
Not reported. | [88] |