
FIGURE 2.
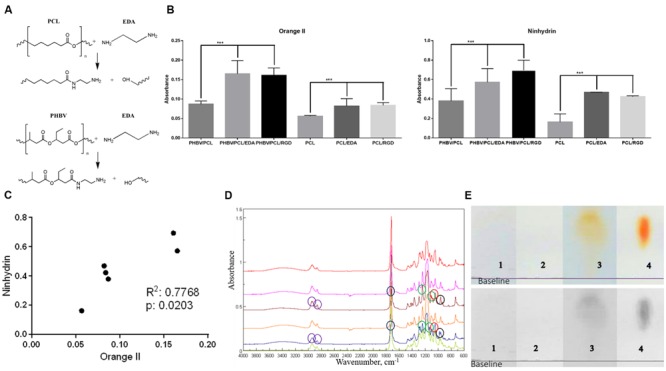
Modification of PHBV/PCL and PCL vascular grafts with RGD peptides. (A) Aminolysis reaction scheme between EDA, PHBV, and PCL monomers. (B) Orange II staining and ninhydrin test demonstrated increased amino group presence in PHBV/PCL and PCL grafts with EDA or RGD peptides compared to those without, data are represented as mean with standard deviation, ∗∗∗P < 0.001, two-tailed Student’s t-test. (C) Concordance test revealed a strong correlation between Orange II and ninhydrin assays for PHBV/PCL and PCL grafts with and without EDA treatment. (D) Fourier transform infrared spectroscopy showed the intensified signal from N–H stretching (around 960 cm-1, black circles) and the increase in amino residues in PHBV/PCL and PCL grafts with RGD peptides (brown and blue graphs, respectively). Peak around 1045 cm-1 (red circles) corresponds to Si-O-Si stretching, peaks around 1172 and 1240 cm-1 (green circles) correspond to C–O ester stretching, peak around 1720 cm-1 (blue circles) corresponds to C = O aliphatic ester stretching, and peaks around 2865 and 2941 cm-1 (violet circles) correspond to C–H asymmetric alkyl stretching. (E) Thin layer chromatography (TLC) spots after analyzing hydrolysed (1) PHBV/PCL, (2) PHBV/PCL/EDA, (3) PHBV/PCL/RGD, and (4) arginine and aspartic acid mixture on chromatographic silica to show the peptide content only in the RGD modified sample.