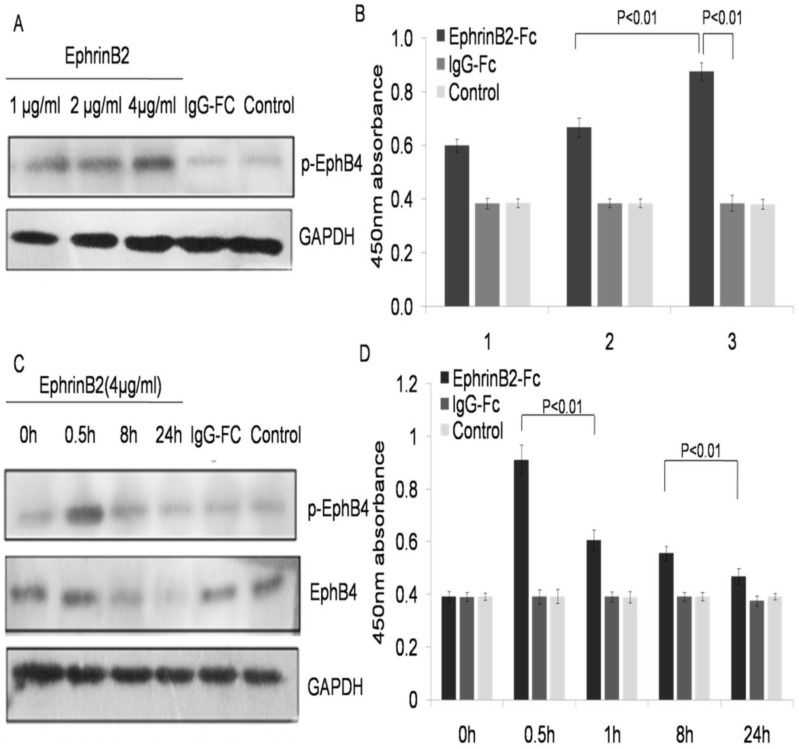
Figure 6.
Ephrin B2 enhanced EphB4 phosphorylation and decreased expression of EphB4 protein in a dose dependent manner. A. Phosphorylation of EphB4 in the K562-R cell line after treatment with different concentrations of soluble ephrinB2 protein by western blot. B. Comparison of 450nm absorbance in K562-R cells after treatment with different concentrations of soluble EphrinB2 protein. 1-3 groups represent: 1. EphrinB2-Fc (1 µg/ml), IgG-Fc (0.1 µg/ml); 2. EphrinB2-Fc (2µg/ml), IgG-Fc (0.2µg/ml); 3. EphrinB2-Fc (4µg/ml), IgG-Fc (0.4µg/ml). The blank control had no treatment for each group. C. Expression and phosphorylation of EphB4 in the K562-R cell line following treatment with the soluble ephrinB2 (4µg/ml) protein at a different time by western blot. D. Comparison of 450nm absorbance in the K562-R cell line treated with the soluble ephrinB2 (4µg/ml) protein at a different time.

