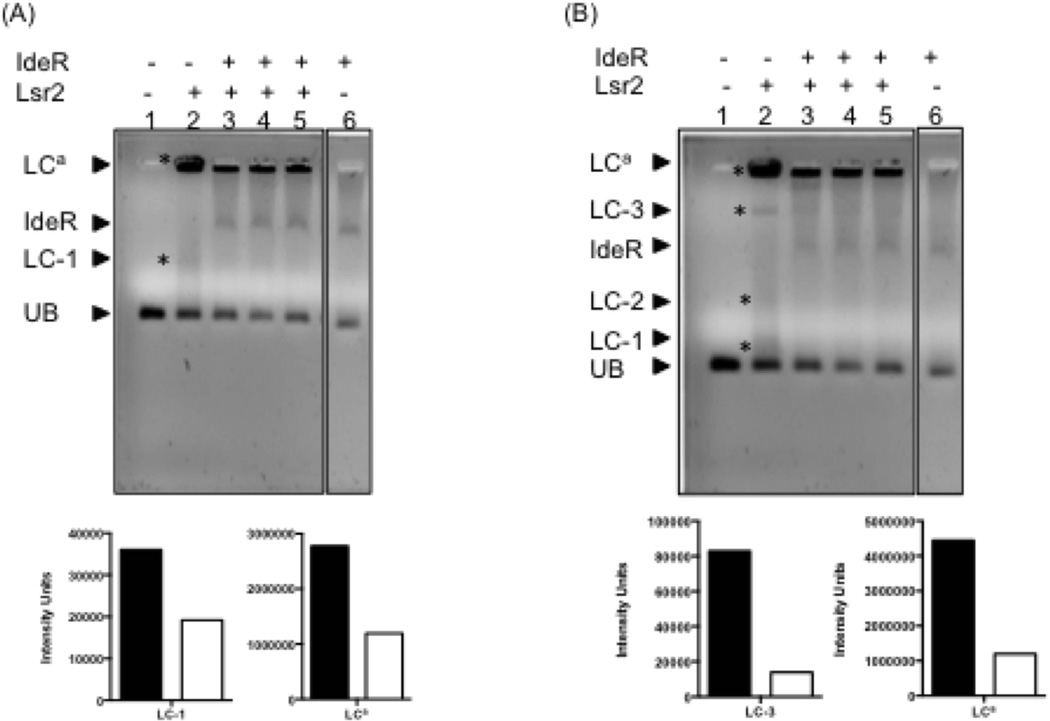
Figure 9.
IdeR can partially displace Lsr2 from PbfrB in vitro. A DNA fragment containing 121 bp upstream of bfrB including IB1-4 was incubated individually with Lsr2 (concentration 4.2 µM) (lane2), IdeR (concentration 6.7 µM) (lane 6) or first with Lsr2 followed by IdeR at increasing concentrations (4, 5 and 6.7 µM) (lanes 3–5), as described in experimental procedures. Protein-DNA complexes were resolved on a 0.9% TA agarose gel containing 1X SYBR green at 4°C. Digital images of the same gel were acquired after 45 or 60 min electrophoresis (panel A and B respectively ) to aid the visualization of low and high molecular weight Lr2-DNA complexes. The Lsr2 complexes in each gel are indicated by *. UB: PbfrB DNA probe (50 ng); IdeR: IdeR-PbfrB complex; LC-1: low molecular weight Lsr2-DNA complex; LC-2 and LC3: Intermediate weight Lsr2-DNA complexes; LCa: aggregates of Lsr2-DNA. The relative intensity of the bands corresponding to main Lsr2-DNA complexes is shown in the graphs under each gel image. The filled bars represent the intensity of the DNA shifts with Lsr2 alone (lane 2) and open bars represent the intensity of Lsr2 complexes in the presence of IdeR added at the highest concentration (lane 5).

