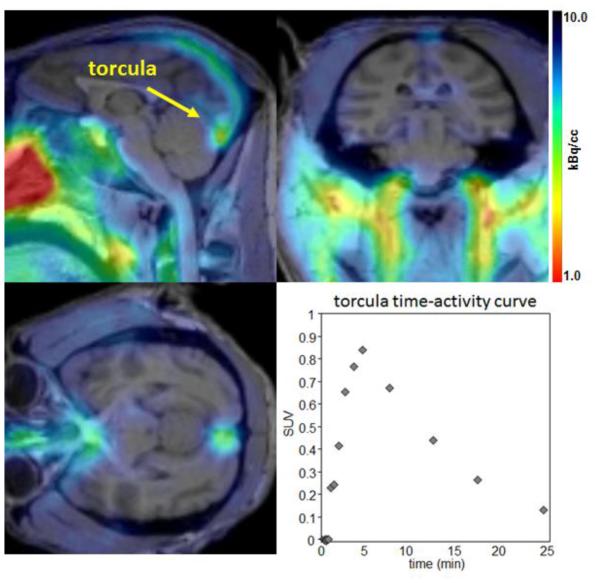
Figure 2.
Summed PET (0-15 min) with structural MR images (top). Radioactivity is seen primarily in the confluence of the sinuses (torcula) with the highest intensity just inside the occipital protuberance (lower left). Time-activity curve for the radioactivity observed is also shown (bottom right).

