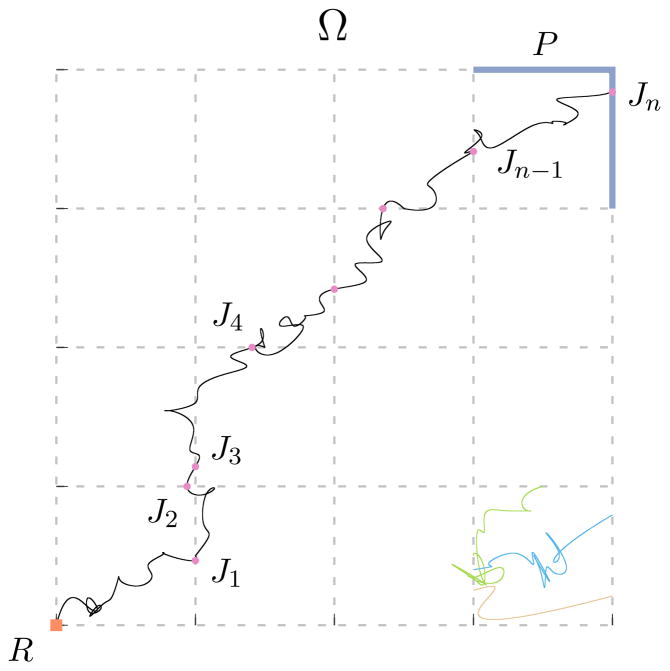
Fig. 1.
Representation of the state space Ω and the milestones. Each milestone is an edge of one of the squares traced by dashed grey lines. The reactant state R is highlighted as a square dot in the left-bottom corner while the product state P is comprised of the two line segments shown in blue at the upper-right corner. A particular realization of a long trajectory appears as a continuous black line and the corresponding values of the process (Jn) are marked with circles. The individual trajectories shown in different colors near the bottom-right corner represent trajectory fragments as used in the Milestoning algorithm.

