
Figure 4.
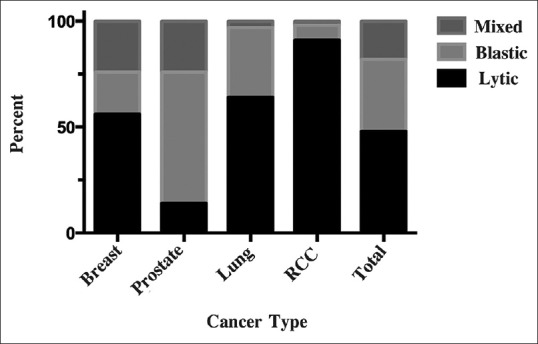
Bar graph depicting proportion of vertebral body metastasis that are lytic, blastic, or mixed for breast, prostrate, lung, renal cell cancer, and all analyzed cancers combined (total)
Official websites use .gov
A
.gov website belongs to an official
government organization in the United States.
Secure .gov websites use HTTPS
A lock (
) or https:// means you've safely
connected to the .gov website. Share sensitive
information only on official, secure websites.
Bar graph depicting proportion of vertebral body metastasis that are lytic, blastic, or mixed for breast, prostrate, lung, renal cell cancer, and all analyzed cancers combined (total)