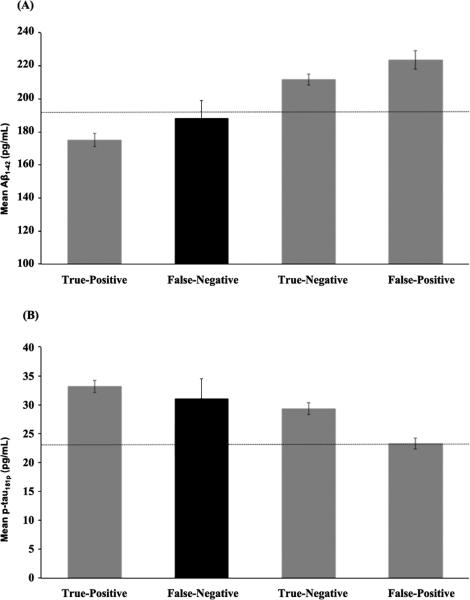
Fig. 3.
CSF (A) Aβ1-42 and (B) p-tau181 biomarkers levels for the true-positive participants (i.e., amnestic MCI, dysnomic MCI, and dysexecutive/mixed MCI [4]; n = 278 with CSF data), false-negative participants (n = 24 with CSF data; highlighted in black), true-negative participants (n = 324 with CSF data), and false-positive participants (i.e., Cluster-Derived Normal [4]; n = 156 with CSF data). Error bars represent standard error of the mean. The dotted lines represent the cut-points for an abnormal value (Aβ1-42:<192 pg/mL; p-tau181p:>23 pg/mL) [8].

