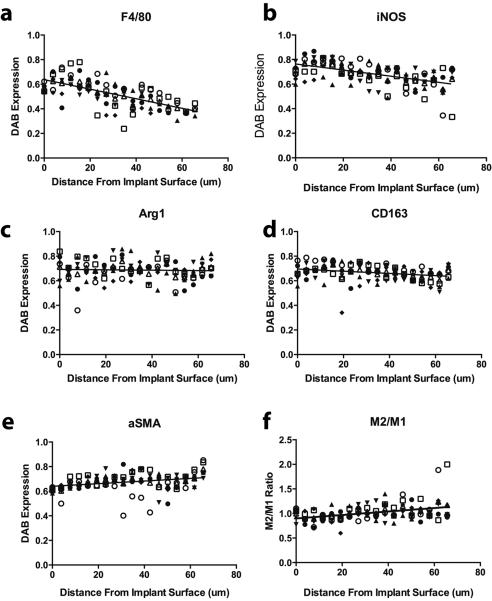
Figure 7.
Spatial distribution of staining intensity of the different markers from inner to the outer edge of the fibrous capsule. Data shown are average values for 0.3% glutaraldehyde at 21 days (n=6), which are representative of trends observed for all hydrogel crosslinking concentrations and time points. Different symbols represent results from different mice.

